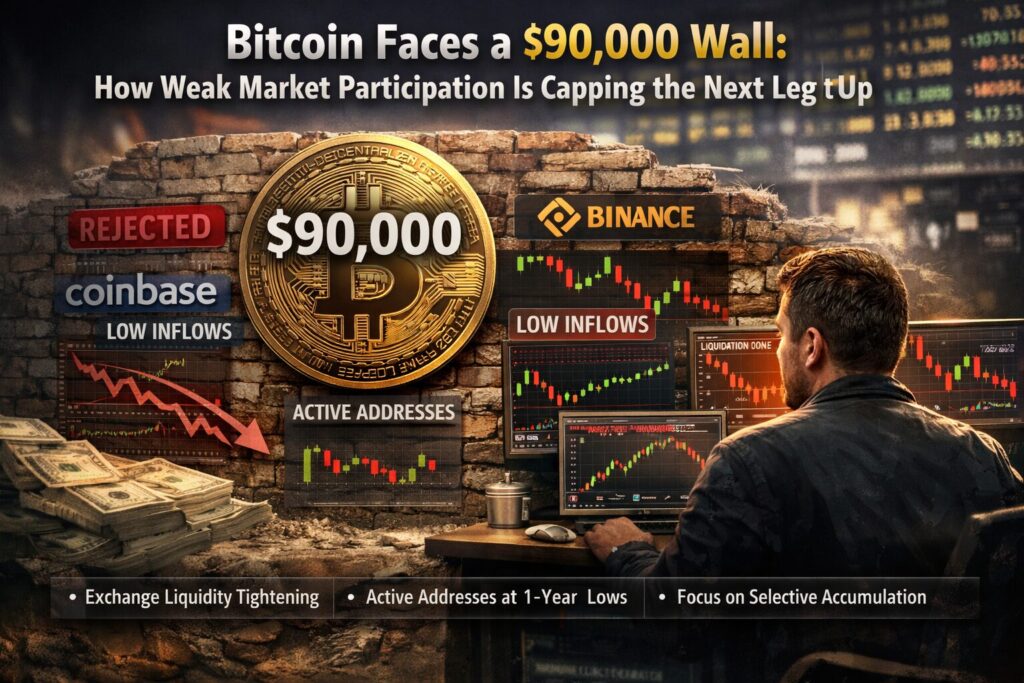
Main Points :
- Bitcoin is consolidating around $87,000–$88,000, but declining on-chain activity and shrinking exchange liquidity are preventing a clean breakout above $90,000.
- Network usage indicators, especially active addresses, have fallen to one-year lows, signaling reduced retail and short-term trader participation.
- Exchange inflows on Coinbase and Binance have dropped sharply compared with late November, tightening short-term liquidity.
- Technically, Bitcoin remains trapped in a $85,000–$90,000 range, with significant liquidation clusters on both sides that could dictate the next directional move.
- For investors seeking new crypto assets, yield opportunities, or practical blockchain use cases, this environment favors selective accumulation and strategy over aggressive momentum chasing.
1. Bitcoin at a Standstill Near $87,000
Bitcoin (BTC) has spent recent weeks hovering around the $87,000 level, repeatedly testing but failing to decisively break through the psychologically important $90,000 mark. On the surface, price stability near all-time-high territory might suggest strength. However, a deeper look at on-chain data and exchange behavior reveals a market that is increasingly thin and cautious.
Unlike explosive rallies driven by fresh capital inflows and expanding participation, the current price action reflects maintenance rather than expansion. Long-term holders appear content to hold, while new participants are not entering the market in sufficient numbers to push prices meaningfully higher.
This dynamic is critical for readers interested in identifying the next revenue opportunity in crypto. When participation wanes, upside potential becomes limited in the short term—but such phases often precede volatility expansions once liquidity returns.
2. Slowing Network Activity Signals Reduced Engagement
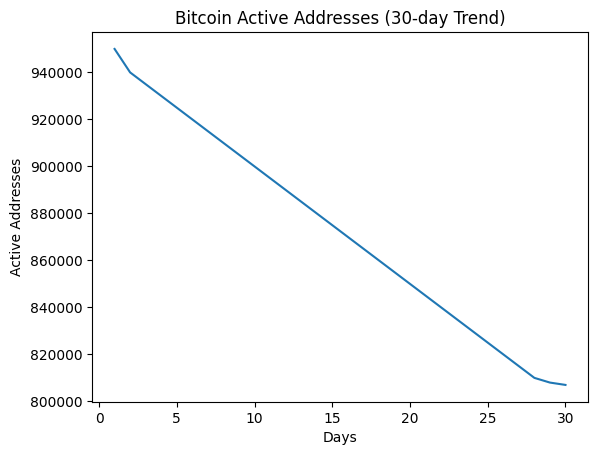
According to data from CryptoQuant, Bitcoin’s network usage has cooled noticeably. The 30-day moving average of active addresses has declined to roughly 807,000, the lowest level observed in the past year.
Active addresses are widely used as a proxy for real economic activity on the Bitcoin network. When this metric rises, it usually reflects increasing participation from retail users, traders, and payment flows. When it falls, it often indicates that speculative interest is fading.
Why This Matters
- Retail participation is subdued: Fewer users are sending, receiving, or interacting with BTC on-chain.
- Short-term traders are stepping back: Lower activity suggests reduced arbitrage and speculative trading.
- Price becomes liquidity-dependent: Without new users, price movements rely more on derivatives positioning than organic demand.
For blockchain practitioners, this highlights an important reality: price alone does not equal adoption. Even at elevated price levels, actual network usage can stagnate, affecting fee markets, miner economics, and second-layer activity.
3. Exchange Flows Reflect a Market in Wait-and-See Mode
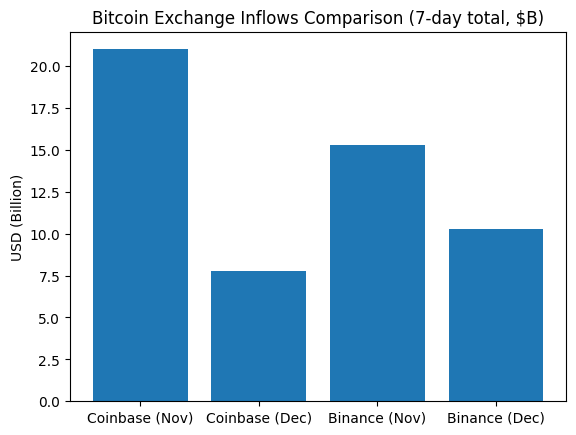
Exchange inflow and outflow data reinforces the picture of muted participation.
In late November, when Bitcoin was trading around $88,500, combined 7-day inflows reached approximately:
- $21.0 billion on Coinbase
- $15.3 billion on Binance
These levels suggested active portfolio rebalancing, hedging, and speculative positioning.
By contrast, as of December 21, with Bitcoin trading near similar price levels:
- Coinbase inflows dropped to about $7.8 billion (a ~63% decline)
- Binance inflows fell to roughly $10.3 billion
This sharp contraction indicates that new liquidity entering the market has dried up.
Interpretation
- Low inflows mean fewer coins are being sent to exchanges to sell—reducing immediate sell pressure.
- Low outflows imply investors are not aggressively accumulating or withdrawing coins for long-term storage.
- The result is a liquidity squeeze, where price becomes more sensitive to smaller order flows.
For readers exploring yield strategies or altcoin rotations, such conditions often lead to range trading rather than sustained trends.
4. Long-Term Holders Are Calm—but Not Aggressive Buyers
One notable aspect of the current environment is the behavior of long-term holders (LTHs). Despite Bitcoin’s proximity to record highs, there is no evidence of panic selling. This suggests confidence in the long-term narrative—spot ETFs, institutional adoption, and Bitcoin’s role as digital collateral remain intact.
However, LTHs are also not accelerating accumulation at these levels. This neutrality contributes to price stagnation.
From a strategic standpoint:
- Long-term conviction remains strong.
- Short-term catalysts are lacking.
- Capital is waiting for either a clear breakout above resistance or a deeper pullback to re-enter.
5. Technical Structure: A Tight $85,000–$90,000 Range
From a technical analysis perspective, Bitcoin is locked in a clearly defined range.
- Support zone: ~$85,000–$86,500
- Resistance zone: ~$90,000–$92,000
The price is currently trading below the monthly VWAP (Volume Weighted Average Price), reinforcing a neutral-to-cautious bias.
Liquidity and Liquidation Zones
Data from CoinGlass highlights significant liquidation clusters:
- Downside liquidity:
- $85,800–$86,500
- Concentration of leveraged long positions
- Over $60 million in potential long liquidations
- Upside liquidity:
- $90,600–$92,000
- Dense short positioning
- Roughly $70 million in potential short liquidations
In such environments, price often moves toward liquidity, not fundamentals. The next sharp move is likely to be fast and mechanically driven.
6. What Would It Take to Break $90,000?
A sustainable breakout above $90,000 would likely require one or more of the following catalysts:
- Renewed inflows into spot Bitcoin ETFs, signaling fresh institutional demand.
- Macro tailwinds, such as clearer signals of interest rate cuts or dollar weakness.
- On-chain revival, with active addresses and transaction counts turning upward.
- Narrative expansion, for example, increased use of Bitcoin as collateral in DeFi or payment rails.
Absent these drivers, upside attempts may continue to fail, reinforcing the range-bound structure.
7. Implications for Crypto Investors and Builders
For readers interested in discovering new crypto assets or revenue streams, the current Bitcoin environment offers several lessons:
- Momentum strategies are risky in low-participation markets.
- Volatility strategies (options, range trades) may outperform directional bets.
- Altcoins with independent catalysts—real adoption, protocol upgrades, or yield mechanisms—may offer better risk-adjusted returns.
- Builders should focus on infrastructure, payments, and real-world integrations, which are less sensitive to short-term price action.
This is a market phase where discipline and selectivity matter more than speed.
8. Conclusion: Compression Before Expansion
Bitcoin’s struggle at the $90,000 level is not a sign of weakness in the long-term thesis. Rather, it reflects a market that is temporarily under-participated and liquidity-constrained.
History shows that such periods of compression often precede sharp expansions—either upward or downward. For now, Bitcoin remains balanced between confident holders and cautious newcomers.
For investors and blockchain practitioners alike, the message is clear:
watch participation, not just price. When activity returns, the next major opportunity—whether in Bitcoin itself or the broader crypto ecosystem—will not be far behind.
