Key Takeaways :
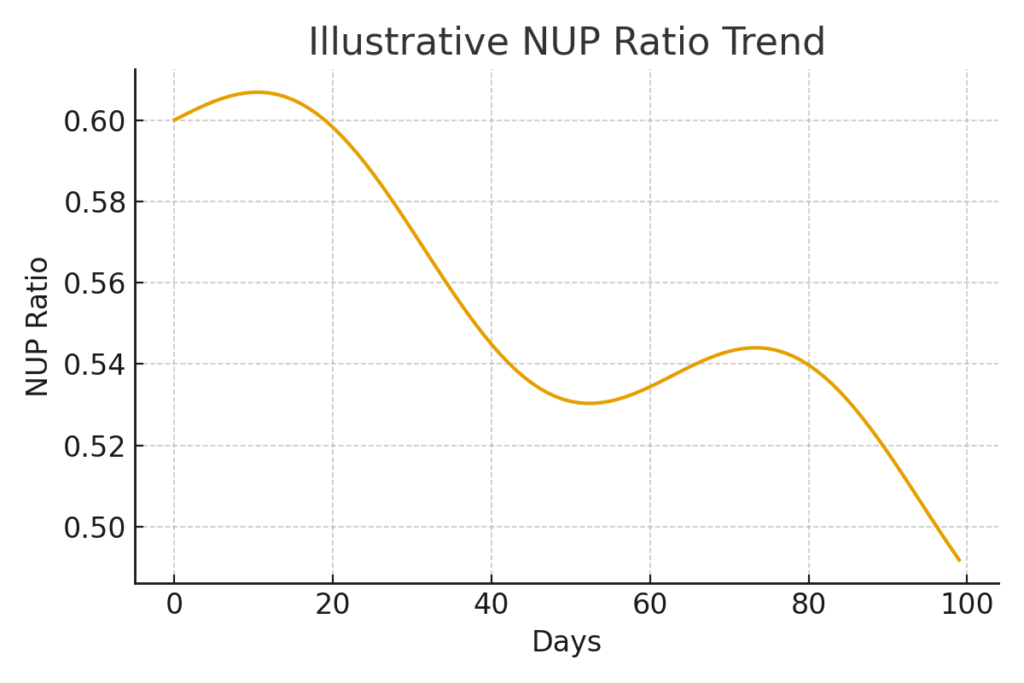
- The Net Unrealized Profit (NUP) ratio has fallen to 0.476, a level historically associated with short-term Bitcoin market bottoms.
- Similar NUP readings in 2024 and late 2025 preceded rapid rebounds of 15–25% within the following month.
- Derivatives leverage flush-outs and declining funding rates closely resemble prior bottoming structures.
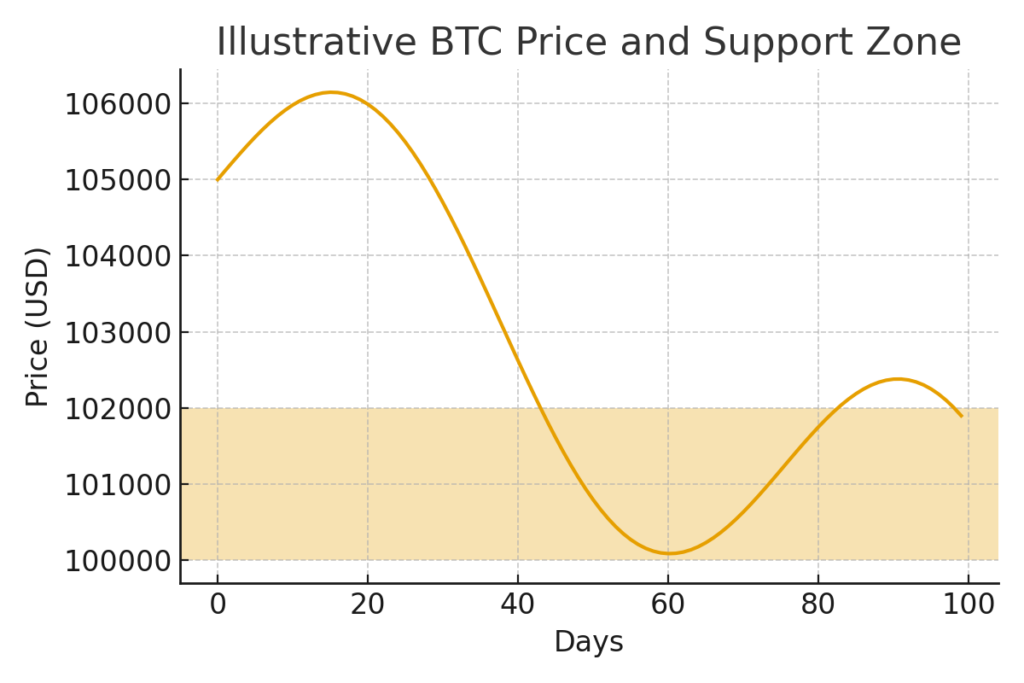
- Bitcoin currently trades around $103,000–$104,000, with a potential support zone near $100,000–$102,000.
- Broader liquidity conditions and global risk sentiment will determine whether a rebound materializes.
I. Introduction: A Market Searching for Direction
Bitcoin’s recent 10% decline has brought the market into a familiar psychological phase: fear, capitulation, and bottom-watching. Analysts are now turning to one of the most reliable on-chain metrics—the Net Unrealized Profit Ratio (NUP)—which has dropped to 0.476, its lowest level since April. Historically, this indicator marks a zone where sellers exhaust themselves and where long-term investors begin to accumulate.
The NUP ratio measures how much profit (or loss) the holders of all coins would realize if they sold at current market prices. Lower readings indicate that most coins are trading near their cost basis or below, signaling capitulation. Higher readings indicate frothy markets and likelihood of profit-taking.
According to new data from CryptoQuant, the current NUP level aligns almost perfectly with past periods of aggressive sell-offs followed by sharp price recoveries. This gives traders a probabilistic—but not guaranteed—edge in anticipating the next move.
II. Understanding the NUP Ratio and Why It Matters
1. What NUP Measures
The NUP ratio compares:
- The current price of all coins on the blockchain
vs. - The price at which each of those coins last moved (its cost basis)
When the market is euphoric, the ratio expands toward 0.7–0.8.
When fear and capitulation dominate, NUP compresses toward 0.45–0.48.
2. Historical Behavior of NUP
Data since 2018 shows three key characteristics:
- NUP reliably signals local bottoms (not macro bottoms).
- NUP < 0.48 almost always precedes short-term reversals.
- Reflexive rebounds typically yield 15–25% price gains within 30 days.
These patterns held during:
- Feb 2024 (BTC: $42,000 → $70,000)
- Mid-2024 correction (BTC recovered rapidly after leverage flush-out)
- Oct 2025 (BTC rebounded from $100,000 to $110,000)
Today’s NUP reading matches these historical zones of capitulation.
III. Current Market Snapshot
Bitcoin is trading near $103,000–$104,000, down roughly 10% from last week’s high. The decline was accompanied by:
- Liquidation of over-leveraged long positions
- Funding rates resetting sharply lower
- Derivatives open interest dropping significantly
- Stabilization of US Treasury yields after recent volatility
This combination mirrors the same structural patterns seen before prior short-term bottoms.
IV. Why $100,000–$102,000 Remains a Critical Support Zone
Several technical and on-chain indicators now converge around the same support range:
1. Psychological Level: $100,000
A massive round-number barrier that typically attracts buyers.
2. Cost Basis Cluster
On-chain data shows a dense concentration of long-term holder cost basis near $98,000–$103,000.
3. Options Market Positioning
Large open interest in put options around $100k suggests a theoretical “max pain” area.
4. Rebound Probability
Historically, bottoms forming at NUP < 0.48 see rebounds to:
- $115,000–$128,000 in strong liquidity conditions
- $110,000–$118,000 in neutral macro environments
V. Latest Market Developments from Other Analysts
Recent commentary from major research shops adds supportive context:
1. Glassnode Analysts
Glassnode reports that long-term holders are increasing their positions, absorbing supply from short-term speculative traders.
2. Coinbase Institutional
Coinbase notes that persistent ETF inflows continue despite volatility in the spot market, demonstrating structurally strong demand.
3. Macro Impact
Global risk sentiment has mildly improved as:
- US Treasury yields stabilize
- Expectations of future Fed easing strengthen
- Geopolitical risk remains contained
If macro conditions remain neutral or positive, Bitcoin’s probability of a short-term rebound increases significantly.
VI. Strategic Implications for Investors Seeking Opportunities
For readers actively searching for:
- New crypto assets
- New revenue opportunities
- Practical blockchain applications
…the current environment provides several actionable insights.
1. Short-term Traders
NUP < 0.48 historically indicates a high-probability reversal zone, making this a tactical entry opportunity for short-term trades.
2. Long-term Investors
Cost basis compression across the network implies a favorable accumulation window.
3. Builders and Operators
Periods of market fear often precede upticks in:
- Venture capital deployment
- New chain integrations
- Infrastructure upgrades
- Layer-2 scaling adoption
Investor and developer activity historically rises within 2–3 months after such capitulation periods.
VII. Final Assessment: Is This the Bottom?
No indicator can provide absolute certainty. However, the convergence of:
- NUP ratio at historical capitulation levels
- Declining leverage and normalized funding rates
- Support forming near $100k
- Stabilizing macro environment
…collectively suggests a probabilistic short-term bottom.
If conditions follow historical behavior, Bitcoin could see a 15–25% rally toward the $115,000–$128,000 range within the next month.
This setup is not guaranteed, but the structural conditions mirror previous successful bottoming patterns with remarkable consistency.
