Main Points :
- Bitcoin (BTC) in JPY terms broke above the short-term descending trendline, recovering above ¥16.3M (~$110,000).
- U.S. PMI and employment indexes slipped below 50, bolstering Fed rate-cut expectations and aiding BTC’s rebound.
- Rising long-term bond yields and fiscal worries among major economies support both gold and BTC as non-national assets.
- Technical metrics such as hash rate, difficulty, and futures funding rates remain stable, reflecting healthy network fundamentals.
- Alts remain cautious, with Bitcoin leading — altcoin structural setups suggest potential future altseason.
- Interest-rate dynamics, ETF inflows, and whale behavior continue to influence BTC’s price trajectory.
1. Bitcoin Technical Breakout and Market Reaction
Bitcoin’s yen-denominated market began the day on September 2 at around ¥16,096,286 ($110,000), and maintained upward momentum through Tokyo trading hours. It breached the ¥16.3M level, a short-term descending trendline, rallying into the high ¥16.3M range (≒ $111,000). However, when U.S. stock futures initially dipped, BTC pulled back to around ¥16.2M. A surprise came when the ISM manufacturing PMI and employment indexes both fell below the critical 50 threshold, signaling contraction—this catalyzed revived expectations for Fed rate cuts, pushing BTC back toward ¥16.5M ($112,000) by the close. BTC thus recovered most of its previous week’s losses.
2. Macroeconomic Catalysts: Fed Rate-Cut Expectations & Bond Yields
In the U.S., both the PMI and employment indexes edging below 50 heightened hopes for a September Fed rate cut—markets now price in more than a 90% probability of a 25bp cut, with further cuts anticipated later in 2025.
Simultaneously, fiscal concerns in major economies have triggered upward pressure on long-term bond yields, steepening the yield curve. This, in turn, strengthens gold’s appeal—and by extension, benefits Bitcoin as a non-sovereign store of value analogue.
3. Technical Fundamentals: Network Health & Futures Funding
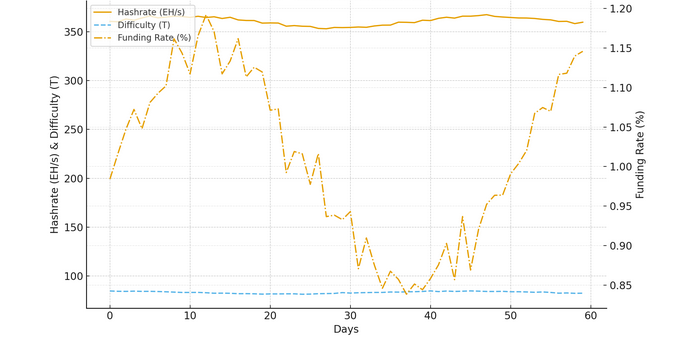
Data from bitbank.cc and Glassnode show that Bitcoin’s hash rate and mining difficulty remain robust, indicating a healthy network. Futures funding rates remain stable, suggesting balanced sentiment among derivatives traders. This technical consistency supports confidence in BTC’s breakout.
4. Altcoins: Structural Setups Signal Potential Rebound
While alts have generally lagged behind BTC, emerging structural setups echo patterns preceding the 2021 “altseason.” Analysts observe Wyckoff-style accumulation, “spring,” and range reclaim phases in alt-to-BTC market cap ratios, suggesting altcoin rallies may follow if momentum holds .
5. Recent Trends & Price Levels to Watch
- Bitcoin recently dipped to approximately $107,000 before finding support and confirming a bottom; bullish consolidation may continue.
- Technically, BTC has cleared a descending trendline and reclaimed the $110k–$111k zone—critical psychological and technical support.
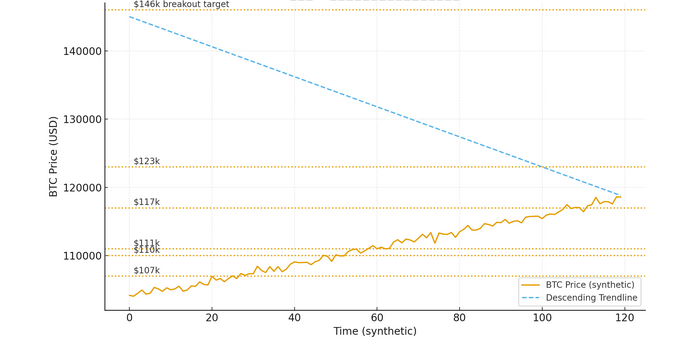
- Key price levels: support near $107,000 and $100,000; resistance lies near $117,000–$123,000 (former highs and trendline) .
- A breakout from a descending channel suggests potential upside toward $146,400, a 32% upside from recent breakout levels.
- Volatility remains—BTC is currently on track for its first monthly loss since April, down over 10% from the August all-time high (~$124k).
6. Summary Table of Technical & Macro Indicators
(This could be presented as a simple table or chart—image to be created externally and inserted here.)
Insert Image – Bitcoin Chart & Key Levels
Place chart here showing descending trendline breakout, support/resistance at $107k, $110–111k, $117–123k, and breakout target $146k.
Insert Image – Hash Rate, Difficulty, Funding Rates
A composite chart showing stable hash rate, difficulty, and futures funding.
Conclusion
In summary, Bitcoin’s successful breach of the short-term descending trendline and recovery above ¥16.3M (~$110k) comes amid renewed Fed rate-cut optimism, weaker U.S. economic indicators, and heightened fiscal concerns. Technical fundamentals remain sound, altcoins show early signs of potential rebound, and key price levels provide a roadmap for traders and investors.
Looking ahead, the interplay between macro data (inflation, employment), central bank policy, and institutional flows (ETF and corporate accumulation) will continue to drive BTC’s trajectory. A sustained breakout could open the door toward as high as $146k, while breakdowns under key support zones (~$107k or $100k) could test weaker sentiment.
