
Main Points :
- Sharp rally above $117,000 after Jackson Hole dovish tone quickly reversed.
- Massive whale sell-off (around 24,000 BTC) triggers liquidation cascade and flash crash.
- Bitcoin dips below $110,000; key support zones at $105,000 and $100,000 under threat.
- Seasonal risks heighten with Asia’s “Ghost Month” historically delivering ~21.7% average decline.
- ETF outflows and institutional rotation toward Ethereum increase market fragility.
1: Post-Jackson Hole Rally and Its Collapse
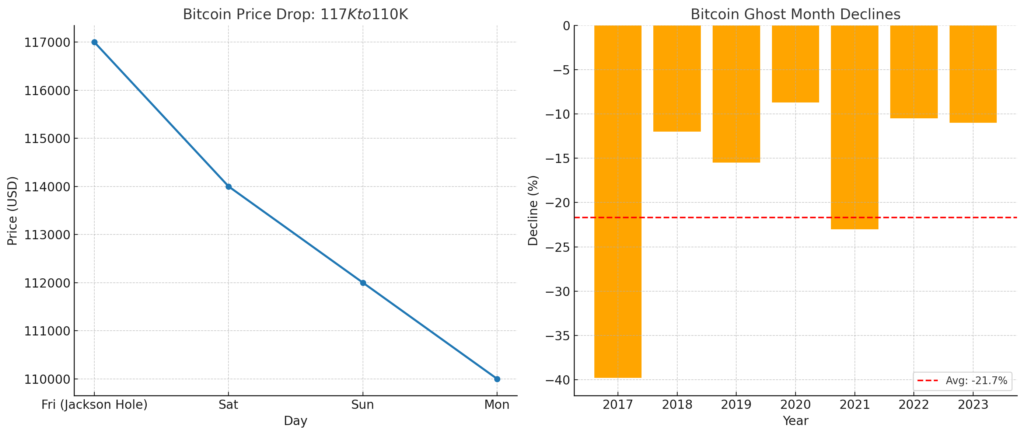
Last week, Bitcoin surged to nearly $117,000 on Friday following a dovish‑leaning speech by U.S. Federal Reserve Chair Powell at the Jackson Hole Economic Symposium. The speech reignited hopes for an imminent rate cut and sparked intense risk appetite across markets.
However, the rally was short‑lived. Over the weekend, a large holder—commonly referred to as a “whale”—offloaded approximately 24,000 BTC, unleashing a flash crash that erased the Friday gains. Within hours, Bitcoin plunged to around $110,000, triggering a wave of liquidations.
2: Liquidations, ETF Outflows, and Shifting Capital
The whale-induced crash precipitated a cascading effect: leveraged long positions were decimated, resulting in liquidation totals ranging from $640 million to over $800 million across crypto markets in just 24 hours.
Simultaneously, ETF-related products saw significant outflows. Spot Bitcoin ETFs witnessed between $1 billion and $1.4 billion in net outflows last week, signaling waning institutional confidence.
3: Technical Near-Term Support and Demand Zones
With Bitcoin slipping below $110,000, market watchers now eye $105,000 as a critical support threshold. Falling below that level may accelerate downside momentum, potentially dragging prices toward the $100,000 psychological level.
4: Seasonal Pressure—Asia’s “Ghost Month”
Seasonal patterns compound investors’ concerns. Asia’s cultural “Ghost Month,” spanning August 23 to September 21 this year, has historically coincided with substantial Bitcoin sell‑offs—averaging 21.7% declines since 2017, including dramatic drops of –39.8% in 2017 and –23% in 2021.
This period tends to suppress risk appetite and encourage profit‑taking, reinforcing technical weaknesses. Still, some investors view any dip into $105,000–$100,000 as a potential strategic entry point before expected Q4 recovery.
5: Market Resilience and Ethereum Rotation
Despite the sell-off, certain metrics hint at underlying resilience. U.S. and South Korean spot demand—measured via the Coinbase Premium and Kimchi Premium—remains elevated, indicating interest in buying the dips.
Meanwhile, capital is rotating into Ethereum. Institutional participants appear increasingly drawn by Ethereum’s staking yields and ETF potential, further weakening Bitcoin’s dominance.
6: Summary Table or Chart Placement
<!– Insert chart here: A two-panel image—left: Bitcoin price chart showing drop from $117k to $110k; right: Historical “Ghost Month” average declines chart. –>
Conclusion
Bitcoin’s brief surge following the Jackson Hole symposium quickly unraveled under the weight of a whale‑induced flash crash, massive liquidations, and ETF outflows. As “Ghost Month” pressures coincide with technical vulnerabilities, markets face heightened downside risks. Still, robust spot demand in key regions and institutional rotation into Ethereum add complexity to the narrative. The $105,000–$100,000 range may serve as a battleground for price stabilization, setting the stage for a potential rebound heading into Q4.
