
Main Points:
- Bitcoin struggles at $120,000 resistance but holds above $115,000 support.
- Short-term ETF outflows signal caution, yet on-chain data shows whale accumulation.
- A decisive break above $123,218 could trigger a rally to $135,729 and beyond.
- A drop below the 20-day SMA (~$115,961) risks a pullback to $110,530.
- U.S. regulatory clarity and macro drivers underpin bullish forecasts.
1. Bitcoin Faces Resistance Around $120,000
Bitcoin (BTC) has repeatedly tested the $120,000 resistance level in mid‑July 2025 but failed to close decisively above it. Earlier this week, BTC briefly spiked above $120,000 before retreating, highlighting aggressive defensive selling at that zone.
Despite this, the price has not fallen below $115,000, indicating that bulls remain unwilling to concede lower ground. Over the past week, U.S. spot Bitcoin ETFs saw net outflows of approximately $285.2 million, suggesting a temporary shift to caution among retail investors.
2. On‑Chain Data and ETF Flows
On-chain analytics reveal that long-term holders and institutional whales continue to accumulate BTC. Exchange reserves have steadily declined, reflecting coins being withdrawn to private wallets—often a bullish indicator for sustained price strength.
Meanwhile, regulatory developments in the U.S. have added fresh tailwinds. The passage of the GENIUS Act, aimed at establishing a clear stablecoin framework, and progress on the CLARITY Act in the House have reduced regulatory uncertainty. This environment has buoyed institutional confidence, with major funds forecasting Bitcoin could reach $200,000 by year-end.
3. Key Technical Levels and Bullish Outlook
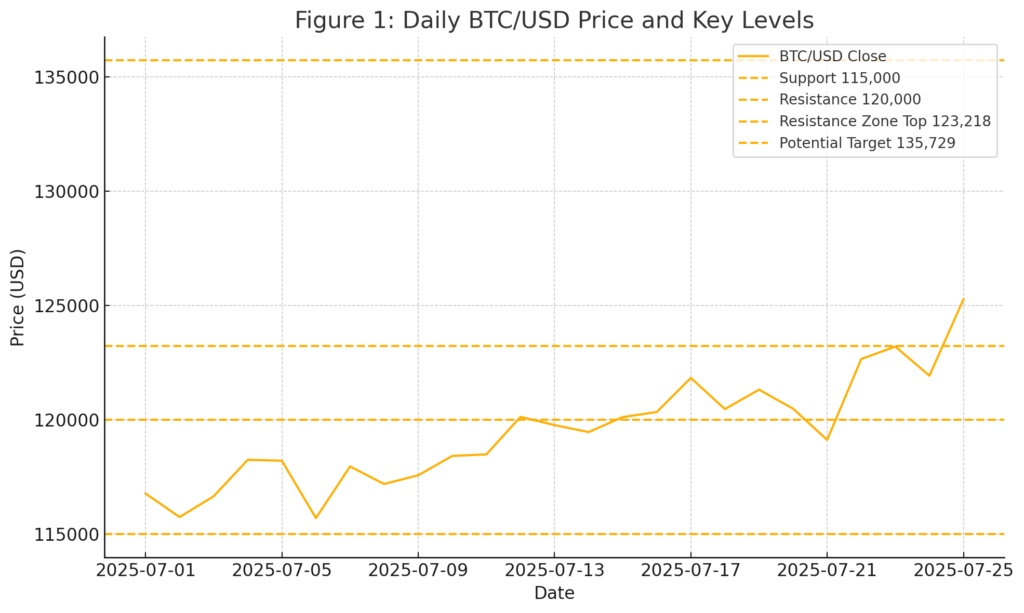
20‑Day Simple Moving Average (SMA): The 20-day SMA, currently near $115,961, has acted as dynamic support. A daily close below this level would mark the first bearish sign, potentially triggering profit‑taking by short‑term traders.
Resistance Zone: The immediate resistance zone lies between $120,000 and $123,218. A break and close above $123,218 would invalidate the bears, opening the path to $135,729 and even $150,000 in subsequent rallies, in line with bullish projections from several analyst reports.
Figure 1: Daily BTC/USD Price and Key Levels (Support: $115,000; Resistance: $120,000, $123,218; Target: $135,729)
4. Short‑Term Bearish Triggers
A decisive daily close below the 20‑day SMA ($115,961) would signal waning bull momentum. In that scenario, BTC may revisit the inverse head‑and‑shoulders neckline around $110,530. A further breach of $110,530 would shift control to the bears, risking a drop toward $100,000 in a worst‑case technical breakdown.
5. 4‑Hour Chart Insights
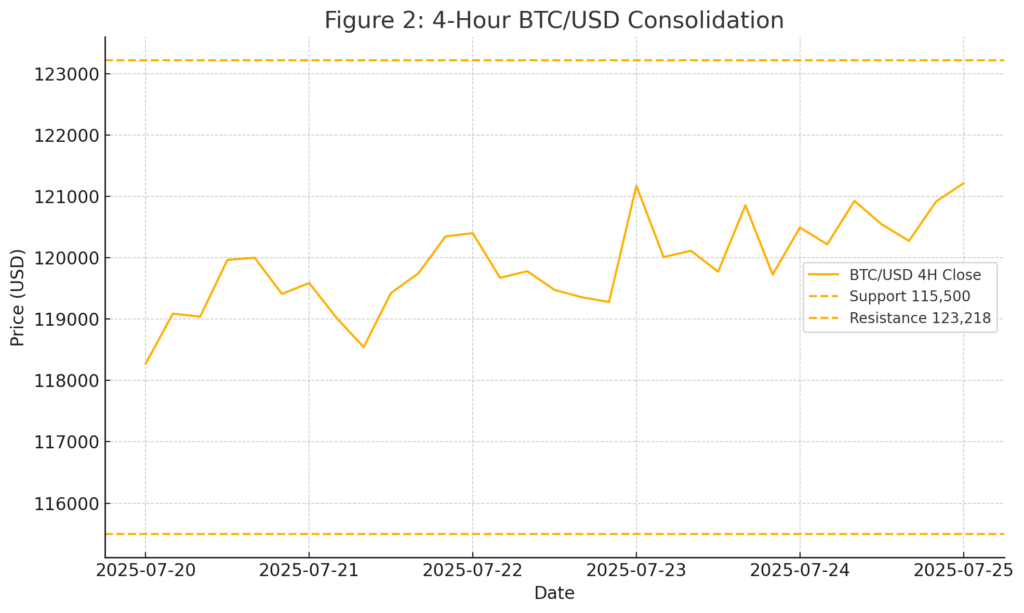
On the 4-hour timeframe, BTC price action has formed a tight consolidation just below recent highs. Both the 20‑ and 50‑period moving averages are flat, and the RSI hovers near 50, indicating equilibrium between buyers and sellers.
Traders eye a close above $123,218 on this timeframe to confirm the next bullish leg. Conversely, a 4-hour close below $115,500 could accelerate short‑term selling, drawing BTC down to the $115,530 zone where dip buyers may re‑enter.
Figure 2: 4‑Hour BTC/USD Consolidation (Support: $115,500; Resistance: $123,218)
6. Macro and Regulatory Drivers
Beyond technicals, several broader themes support a bullish outlook:
- Institutional Adoption: New spot ETFs and corporate treasury allocations continue, adding real capital to the market.
- Regulatory Clarity: The GENIUS and CLARITY Acts in the U.S. reduce legal risks and pave the way for more regulated products.
- Halving Impact: Supply pressures from past halving events continue to underpin scarcity narratives.
- Macro Uncertainty: Global inflation concerns and monetary policy shifts make Bitcoin an attractive hedge.
Analysts from major publications now forecast BTC in the $150,000–$200,000 range by year-end, contingent on sustained demand and continued regulatory progress.
Conclusion
Bitcoin’s current consolidation phase around $120,000 is pivotal. A successful break above $123,218 could unleash a rapid rally toward $135,729 and beyond, supported by on‑chain accumulation, ETF inflows, and favorable U.S. legislation. However, failure to hold the 20‑day SMA near $115,961 would shift momentum to the downside, risking a deeper correction.
Traders and investors should watch these technical thresholds closely, while keeping an eye on institutional flows and regulatory developments that may dictate the next major move in Bitcoin’s trajectory.
