Key Points :
- Bitcoin’s potential bottom range is estimated between $46,000 and $54,000
- The CVDD (Cumulative Value Days Destroyed) model suggests a structural support floor
- On-chain capital indicators are weakening, signaling reduced accumulation
- Macro risks (especially geopolitical tensions) could invalidate historical models
- Institutional flows and ETF dynamics may redefine cycle behavior
- The next phase depends on whether Bitcoin follows historical cycles—or breaks them entirely
Introduction: A Market at the Crossroads
Bitcoin is once again approaching a critical inflection point. After hovering around the $66,000 level, market participants are increasingly divided: Is this consolidation before a new rally, or the calm before a deeper correction?
According to prominent on-chain analyst Willy Woo, Bitcoin’s true bottom may lie significantly lower—between $46,000 and $54,000. His conclusion is grounded in historical on-chain models, particularly the CVDD floor, a metric that has reliably indicated macro bottoms across previous cycles.
However, this cycle is fundamentally different. With institutional capital, ETFs, and global macro instability all playing unprecedented roles, the question is no longer just “Where is the bottom?” but rather:
Do traditional Bitcoin cycles still apply?
Understanding the CVDD Model: Bitcoin’s Structural Floor
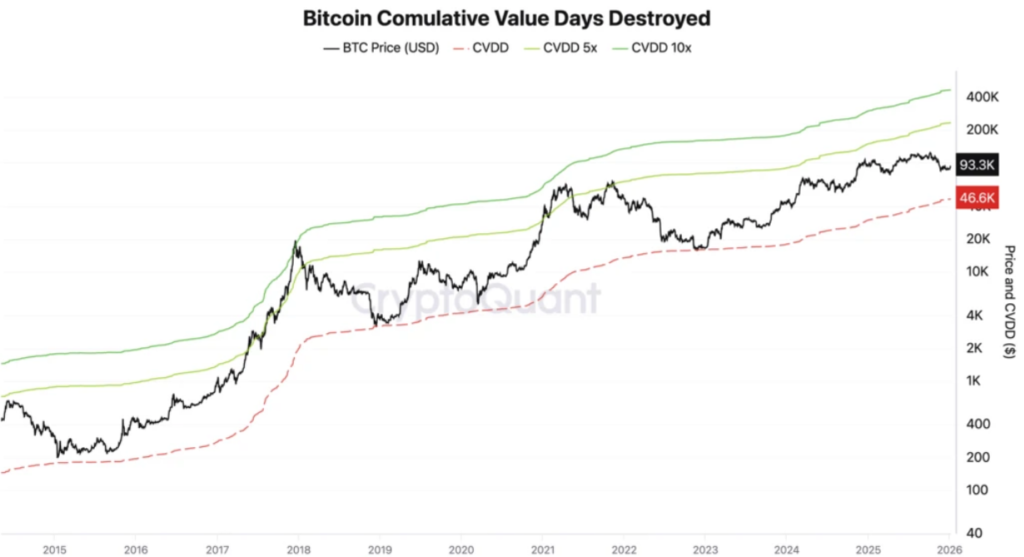
TheIn simple terms, it identifies whenHistorically:
- The CVDD floor has aligned closely with cycle bottoms
- It has successfully predicted major bear market lows in 2015, 2018, and 2022
- It represents a “fair value accumulation zone”
Currently, the CVDD floor sits around $45,500, implying that Bitcoin could still drop further before reaching a statistically strong support level.
This suggests that despite recent price strength, the market may not have fully reset.
Capital Flow Weakness: The “Orange Line” Signal
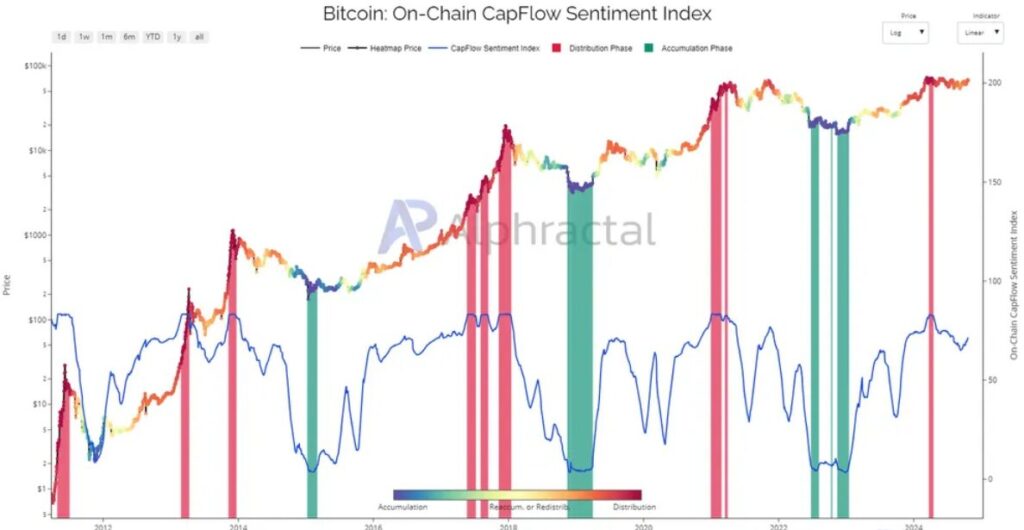
Another critical signal highlighted by Woo is the decline in what is often referred to as the
This metric reflects:
- Total capital stored in Bitcoin
- Investor conviction and long-term holding behavior
Since November, this indicator has shown a downward trend, implying:
- Reduced accumulation
- Increased distribution or profit-taking
- Weakening long-term conviction
This divergence—price holding steady while capital weakens—is historically dangerous.
It often precedes:
- Sharp corrections
- Liquidity-driven sell-offs
- Structural market resets
Historical Cycles vs. a New Market Structure
Bitcoin has historically followed four-year cycles, driven largely by the halving mechanism.
These cycles typically include:
- Accumulation phase
- Bull run
- Distribution phase
- Bear market
However, Woo warns that his models are based on previous four cycles. If the underlying market structure changes, these models may no longer hold.
Today, several new forces are at play:
1. Institutional Capital
Large asset managers now dominate flows, including firms like BlackRock and Fidelity Investments.
2. Bitcoin ETFs
Spot Bitcoin ETFs have introduced:
- Continuous inflows/outflows
- Correlation with traditional markets
- New liquidity dynamics
3. Macro Integration
Bitcoin is now tied more closely to:
- Interest rates
- Inflation expectations
- Global risk sentiment
This raises a crucial possibility:
Bitcoin may no longer behave like a purely cyclical asset.
Macro Risks: The Wildcard Factor
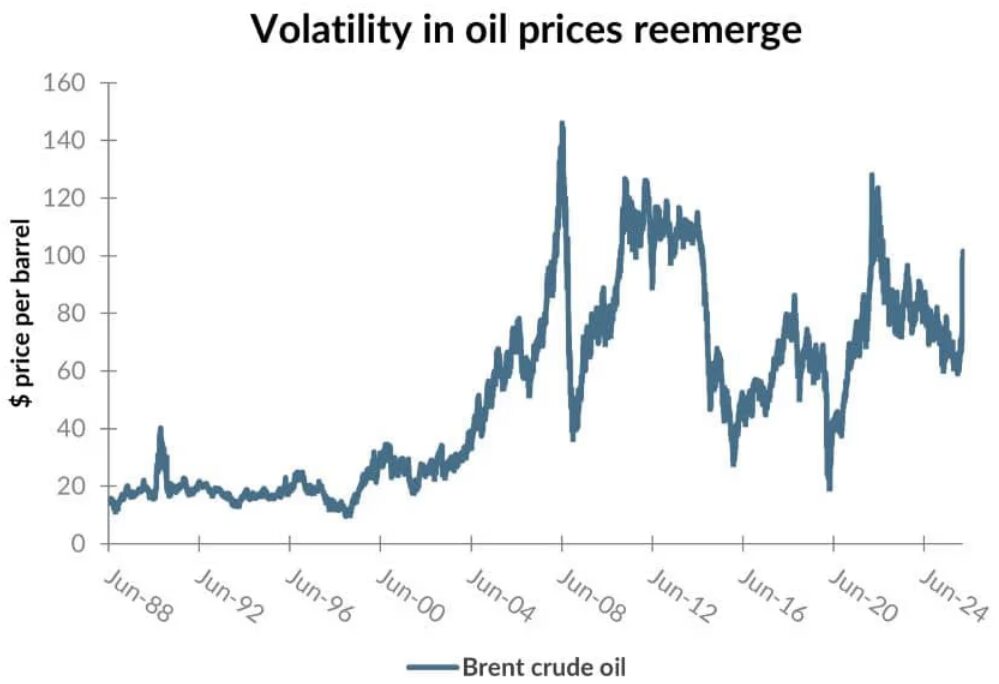
One of the most significant uncertainties today is the macro environment—particularly geopolitical tensions in regions like the Middle East.
Macro risks affect Bitcoin in two opposing ways:
Risk-Off Behavior
- Investors sell Bitcoin alongside equities
- Liquidity dries up
- Prices fall
Hedge Narrative
- Bitcoin is seen as “digital gold”
- Capital flows into BTC as a safe haven
So far, Bitcoin has behaved more like a risk asset than a hedge.
If macro conditions deteriorate further, we could see:
- A move toward the $50,000 range
- Potential testing of the CVDD floor
- Increased volatility across crypto markets
ETF Flows and Institutional Influence
The introduction of spot Bitcoin ETFs has fundamentally changed market dynamics.
Key effects include:
- Daily inflow/outflow volatility
- Increased correlation with stock indices
- Greater influence from traditional finance strategies
Unlike retail-driven cycles, ETF flows are:
- Data-driven
- Macro-sensitive
- Often short-term reactive
This creates a feedback loop:
- Market drops → ETF outflows → further drops
But the reverse is also true:
- Strong inflows → rapid upward momentum
This duality makes predicting bottoms more complex than ever.
Scenario Analysis: Where Is Bitcoin Headed?
Based on current data, we can outline three primary scenarios:
Scenario 1: Soft Landing (Bullish)
- Bitcoin holds above $60,000
- Capital flows stabilize
- New highs emerge in late 2026
Scenario 2: Structural Retest (Base Case)
- Price declines toward $50,000–$54,000
- CVDD floor acts as support
- Market resets before next rally
Scenario 3: Deep Bear Phase (Risk Case)
- Macro shock triggers sell-off
- CVDD fails as support
- Bitcoin enters an “unknown bearish phase”
This third scenario is what Woo warns about—a deviation from historical norms.
What This Means for Investors and Builders
For readers seeking:
- New crypto assets
- Yield opportunities
- Practical blockchain applications
This environment offers both risk and opportunity.
Key Strategic Takeaways
- Accumulation Zones Matter
- $46,000–$54,000 could be long-term entry points
- On-Chain Data Is Still Valuable—but Not Absolute
- Combine with macro analysis
- Infrastructure and Utility Are Rising
- Focus on real-world use cases, not just speculation
- Volatility Is Structural
- Build strategies that survive both bull and bear markets
Conclusion: A Defining Moment for Bitcoin
Bitcoin is no longer just an experimental asset—it is becoming part of the global financial system.
This evolution brings:
- Greater legitimacy
- Deeper liquidity
- But also new risks and complexities
The idea that Bitcoin’s bottom lies between $46,000 and $54,000 is grounded in strong historical data. However, the future may not repeat the past.
As macro forces, institutional flows, and new financial instruments reshape the landscape, Bitcoin stands at a crossroads:
Will it follow its historical cycles—or define a new paradigm entirely?
The answer to that question will determine not only the next bottom—but the future of the entire crypto market.
