Key Takeaways :
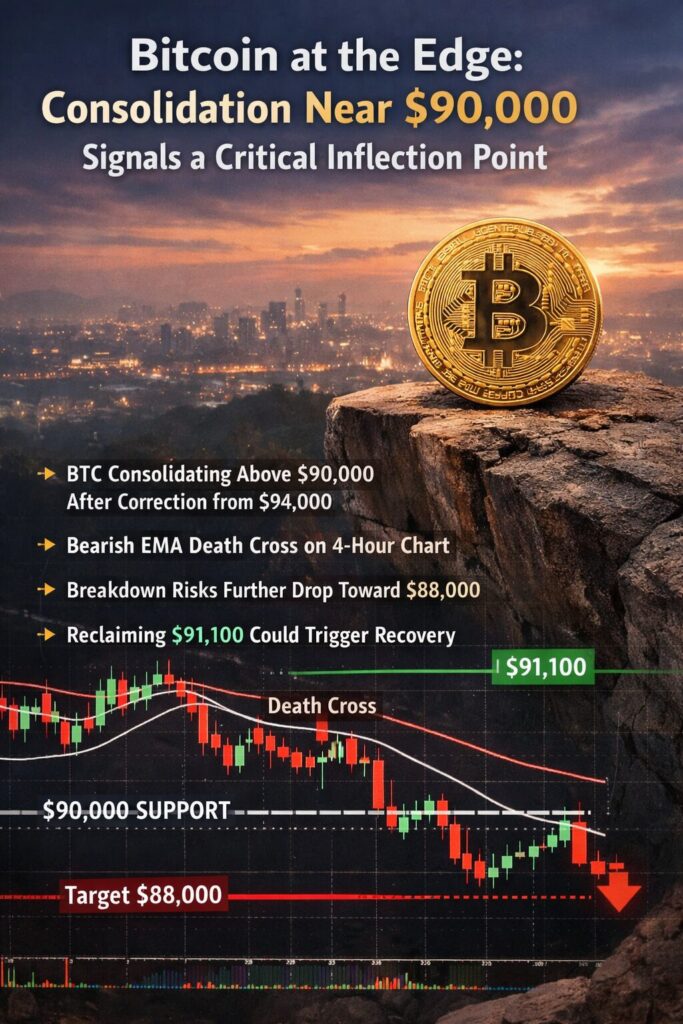
- Bitcoin (BTC) is consolidating just above the psychologically critical $90,000 level after a prolonged correction from $94,000.
- A confirmed bearish EMA death cross on the 4-hour chart suggests downside risk remains dominant in the short term.
- Holding above $90,000 could stabilize the market, while a breakdown risks accelerated selling toward $88,000.
- A decisive reclaim of $91,100 may invalidate the short-term bearish structure and reopen the path to recovery.
1. Market Overview: A Standoff at a Psychological Cliff
Bitcoin is once again testing the nerves of market participants as price action stagnates near one of the most important psychological thresholds in its history: $90,000. Following a correction from the recent $94,000 high, BTC has entered a narrow consolidation range in the low $90,000s, reflecting a market caught between conviction and hesitation.
This kind of price behavior is not unusual during late-cycle or transition phases. Liquidity thins, volatility compresses, and technical indicators begin to dominate short-term decision-making. For traders, this is a battlefield of stop-losses and momentum signals; for longer-term investors, it is a test of structural confidence in Bitcoin’s role as a global digital asset.
2. Technical Structure: The Meaning of the 4-Hour Death Cross
(BTC/USD 4-hour chart with 7-EMA and 28-EMA highlighted, showing the death cross)
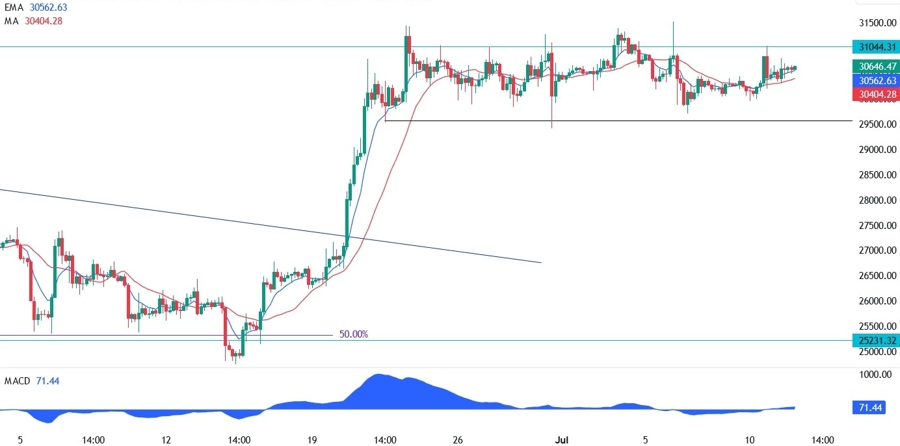
On the 4-hour timeframe, Bitcoin has formed a clear death cross, where the short-term 7-period EMA has crossed below the medium-term 28-period EMA. This configuration is widely interpreted as a bearish continuation signal, particularly when price action remains below both moving averages.
At the time of analysis:
- BTC price: $90,457
- 7-period EMA: ~$90,571
- 28-period EMA: ~$91,057
Each attempted rebound has been capped by the 7-EMA, while the 28-EMA looms above as a second layer of resistance. This creates what many technicians refer to as a “double ceiling,” significantly reducing the probability of a casual upside breakout.
Importantly, this is not a fleeting crossover. The death cross has stabilized, indicating that short-term momentum has decisively shifted in favor of sellers.
3. Support and Resistance: Why $90,000 Matters So Much
The $90,000 level is not merely a round number—it is a structural liquidity zone. Large option strikes, leveraged positions, and psychological anchoring converge at such levels, making them magnets for both defense and attack.
Bearish Scenario: Breakdown Toward $88,000
If Bitcoin decisively breaks below $90,000, the market risks triggering a cascade of stop-loss orders. In such a scenario, price could quickly descend toward $88,000, a visible support region formed by prior consolidation and left-side liquidity on the chart.
This type of move would likely be fast rather than gradual, driven by:
- Forced deleveraging
- Algorithmic momentum trading
- Short-term sentiment capitulation
Bullish Scenario: Reclaiming $91,100
Conversely, the bullish case hinges on reclaiming the EMA cluster. A 4-hour candle close above $91,100 would signal a break above both the 7-EMA and 28-EMA, effectively invalidating the current bearish structure.
Such a move would not guarantee an immediate rally, but it would:
- Neutralize short-term bearish bias
- Encourage sidelined capital to re-enter
- Open the door for a retest of $94,000
4. Broader Context: How This Fits into the 2026 Crypto Landscape
Beyond the chart, Bitcoin’s consolidation reflects broader macro and industry dynamics. Institutional adoption, ETF-driven flows, and sovereign-level interest continue to underpin long-term demand. At the same time, tighter liquidity conditions and profit-taking after a historic rally naturally introduce periods of stagnation.
For builders and operators in the blockchain space, this environment highlights Bitcoin’s evolving role:
- As collateral in DeFi and CeFi systems
- As a settlement asset for cross-border transactions
- As a strategic treasury reserve
These use cases are increasingly decoupled from short-term price fluctuations, even as traders remain highly sensitive to technical signals.
5. Risk Management and Practical Takeaways
For active participants, this is not a market for complacency. Clear invalidation levels exist on both sides, making disciplined risk management essential.
(Scenario diagram showing bearish path to $88,000 and bullish reclaim above $91,100)
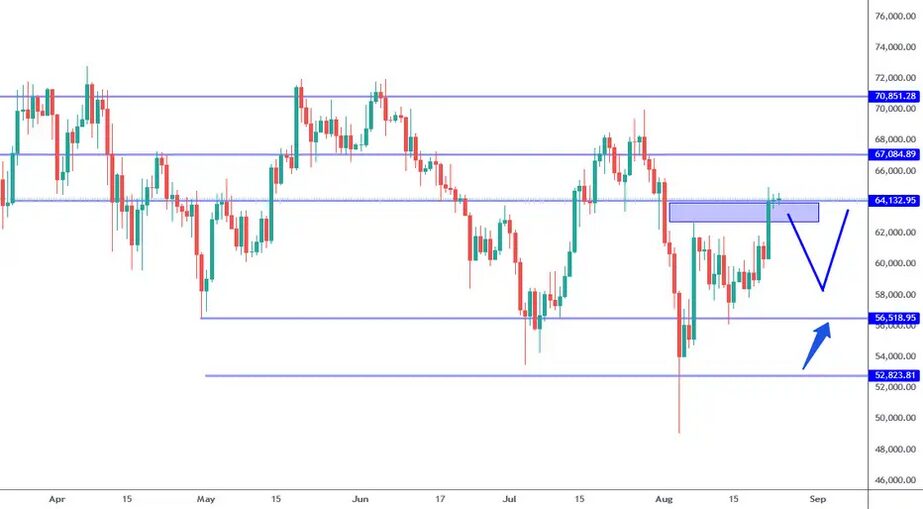
- Short-term traders should respect the EMA resistance zone.
- Long-term holders should monitor whether $90,000 holds on a closing basis rather than reacting to intraday wicks.
- Builders and institutions may view such consolidations as periods to strengthen infrastructure rather than chase momentum.
6. Conclusion: A Decisive Battle at $90,000
Bitcoin stands at a decisive juncture. Pinned beneath key moving averages and hovering above a critical psychological floor, the market is waiting for confirmation. Whether BTC breaks down toward $88,000 or reclaims $91,100 will likely set the tone for the coming weeks.
This is not merely a technical moment—it is a reflection of how mature and structurally significant Bitcoin has become. The outcome of this standoff will echo beyond charts, influencing sentiment, capital allocation, and the pace of innovation across the crypto ecosystem.
