Main Points :
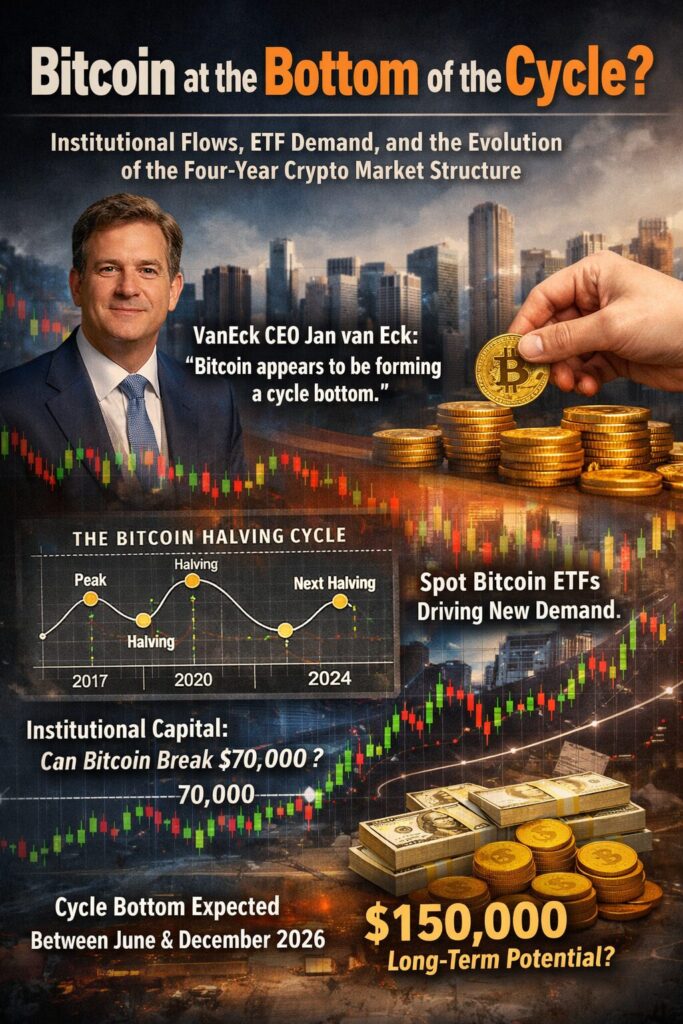
- Bitcoin appears to be forming a cycle bottom according to VanEck CEO Jan van Eck.
- The four-year halving cycle continues to shape Bitcoin market behavior.
- Spot Bitcoin ETFs are creating a new structural demand layer, potentially extending the cycle.
- Institutional capital flows may determine whether Bitcoin can break the $70,000 resistance level.
- Some analysts expect the true cycle bottom between June and December 2026, while bullish forecasts see $150,000 long-term potential.
1. Bitcoin Appears to Be Entering a Cycle Bottom
According to Jan van Eck, CEO of global asset management firm VanEck, Bitcoin may currently be forming a cyclical bottom. VanEck manages approximately $182 billion in assets, and its leadership has become an influential voice in institutional cryptocurrency investment.
Speaking on CNBC’s “Power Lunch,” van Eck explained that the recent decline in Bitcoin’s price does not necessarily signal weakening fundamentals. Instead, it may represent a natural correction within Bitcoin’s well-known four-year market cycle.
Bitcoin fell to around $62,000 in February 2026, before rebounding to roughly $68,000 in early March. Despite this recovery, the cryptocurrency remains down roughly 22% year-to-date and more than 40% below its previous all-time high reached in October 2025.
Historically, Bitcoin markets have followed a recurring pattern tied to its halving mechanism. Prices typically experience three years of upward momentum followed by a major correction in the fourth year. If this pattern holds, 2026 corresponds to the consolidation phase before the next long-term growth cycle begins.
For investors seeking new opportunities in crypto markets, identifying this phase is critical. Historically, the early stages of cycle bottoms have often been accumulation zones where long-term investors quietly build positions.
Bitcoin Price Cycle vs Halving Timeline
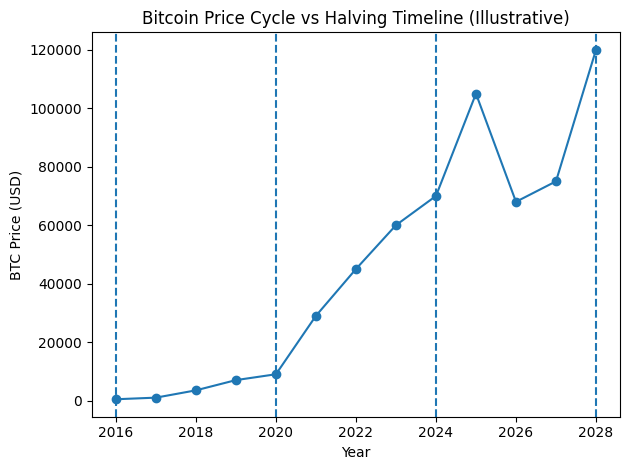
Suggested chart content:
- X-axis: Years (2016–2028)
- Y-axis: BTC price in USD
- Mark halving events
- Highlight current cycle bottom zone
2. Structural Drivers: The 21 Million Supply Cap
Bitcoin’s cyclical behavior is not random. Instead, it is rooted in the cryptocurrency’s fixed supply model.
Unlike fiat currencies that can be expanded indefinitely, Bitcoin’s supply is capped at 21 million coins. This scarcity is enforced through a protocol-level mechanism known as the halving, which reduces the reward paid to miners every four years.
Because the issuance rate declines predictably, Bitcoin operates more like a digital commodity with programmed scarcity. This mechanism creates periodic supply shocks that historically trigger new bull markets.
The most recent halving occurred in April 2024, reducing the block reward from 6.25 BTC to 3.125 BTC. As a result, the number of newly issued bitcoins entering the market was cut in half.
In traditional commodity markets, supply shocks often cause prices to rise sharply. Bitcoin has demonstrated a similar pattern across its history:
| Cycle | Halving Year | Approx. Bull Market Peak |
|---|---|---|
| Cycle 1 | 2012 | 2013 |
| Cycle 2 | 2016 | 2017 |
| Cycle 3 | 2020 | 2021 |
| Cycle 4 | 2024 | Expected 2025-2027 |
However, the current cycle may not behave exactly like previous ones.
A new factor is reshaping the market: institutional investment through Bitcoin ETFs.
3. ETF Inflows Are Transforming Market Dynamics
One of the most significant developments in the cryptocurrency industry over the past two years has been the approval of spot Bitcoin ETFs in the United States.
These investment vehicles allow institutional investors to gain exposure to Bitcoin through traditional financial markets without directly holding cryptocurrency.
The impact has been substantial.
On a single trading day recently, U.S. spot Bitcoin ETFs recorded net inflows of approximately $458 million. This level of demand demonstrates that institutional investors—including pension funds, hedge funds, and wealth managers—are increasingly treating Bitcoin as a legitimate asset class.
ETF demand introduces a new structural element to the Bitcoin market:
- Historically, miners controlled the supply shock after halvings.
- Now, institutional inflows are creating persistent buy-side pressure.
This shift could have major implications.
Instead of short and violent boom-bust cycles, Bitcoin may begin transitioning toward longer, more gradual market cycles, similar to those seen in gold or major commodities.
Some analysts believe that ETF demand could reduce volatility over time, while others argue it may amplify bull markets if institutional flows accelerate.
Either way, the market structure is evolving.
Bitcoin ETF Net Inflows
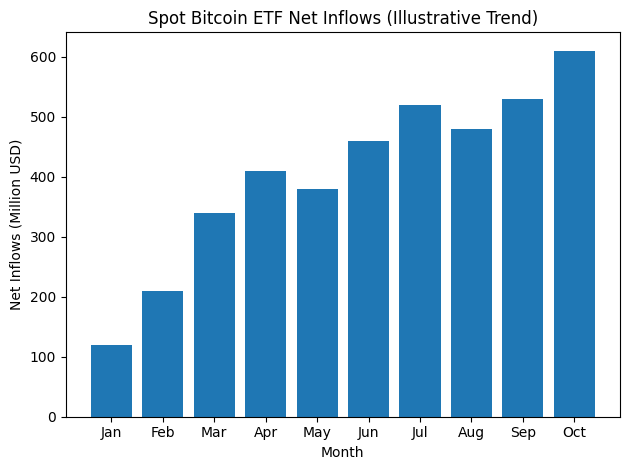
Suggested chart content:
- Bar chart showing cumulative ETF inflows
- Monthly inflows since ETF launch
- Highlight institutional demand trend
File name: bitcoin_etf_inflows.png
4. Institutional Adoption and Market Maturity
Bitcoin’s recent price behavior is also reflected in the performance of related companies.
Van Eck noted that publicly traded firms linked to the crypto ecosystem—including exchanges and infrastructure providers—have experienced similar market cycles.
For example:
- Coinbase has seen its stock price move in tandem with crypto market trends.
- Circle, the issuer of USDC stablecoin, reflects broader demand for digital dollar infrastructure.
These developments suggest that Bitcoin is no longer an isolated asset. Instead, it sits at the center of a growing digital asset financial ecosystem.
This ecosystem now includes:
- Asset managers launching crypto funds
- Banks offering crypto custody services
- Payment companies integrating blockchain rails
- Stablecoin issuers expanding digital dollar liquidity
For investors searching for the next major opportunity in crypto, this broader infrastructure layer may be as important as Bitcoin itself.
Projects focused on tokenization, decentralized finance (DeFi), and blockchain payments are increasingly connected to Bitcoin’s market cycle.
5. When Will the True Bottom Arrive?
While some analysts believe Bitcoin is already near its cycle bottom, others argue that the market could experience further downside or extended consolidation.
Blockchain analytics firm CryptoQuant examined patterns from the previous three Bitcoin cycles and concluded that the most probable timeframe for the next true bottom may fall between:
June 2026 and December 2026
Their model suggests the highest probability window is:
September–November 2026
This projection is based on metrics such as:
- Long-term holder accumulation
- Miner behavior
- Market liquidity trends
- Historical cycle timing
If this analysis proves accurate, the market could spend much of 2026 moving sideways before the next major bullish expansion begins.
For long-term investors, these consolidation phases have historically provided some of the best risk-reward entry opportunities.
Bitcoin Market Cycle Timeline
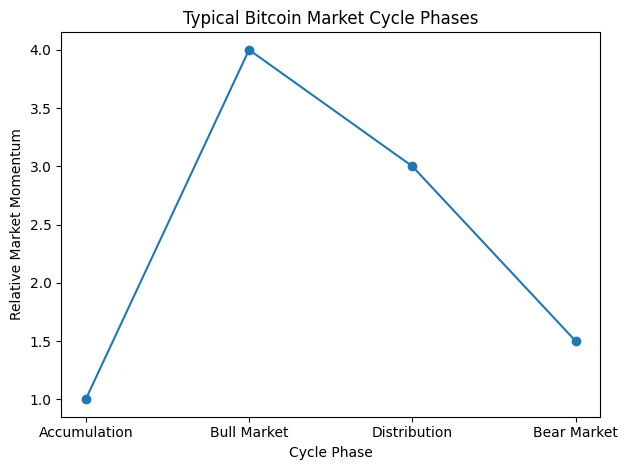
Suggested chart:
- Accumulation phase
- Bull market phase
- Distribution phase
- Bear market phase
Highlight the expected 2026 accumulation zone.
File name: bitcoin_market_cycle.png
6. Long-Term Forecasts: Can Bitcoin Reach $150,000?
Despite the current uncertainty, some major financial institutions remain strongly bullish on Bitcoin’s long-term outlook.
Standard Chartered Bank has previously suggested that Bitcoin could reach $150,000 under favorable conditions.
However, several factors would need to align:
- Continued institutional inflows through ETFs
- Improving global macroeconomic conditions
- Growing adoption of Bitcoin as a reserve asset
- Expansion of digital asset infrastructure
If these trends continue, Bitcoin could increasingly resemble digital gold within global financial markets.
In such a scenario, institutional portfolios might allocate 1% to 5% exposure to Bitcoin, potentially driving significant long-term demand.
7. Key Risks the Market Is Watching
Despite the optimism surrounding Bitcoin’s long-term potential, several risks remain.
One of the most important near-term levels is $70,000, which currently acts as a major psychological resistance level.
If Bitcoin successfully breaks above this threshold, it could trigger renewed bullish momentum.
However, other external factors could influence the market:
Geopolitical tensions
Conflicts in regions such as the Middle East can create macroeconomic uncertainty that impacts risk assets.
Institutional capital flows
ETF demand must remain strong to support the current market structure.
Global liquidity conditions
Interest rate policies and central bank decisions can affect capital flows into alternative assets like Bitcoin.
These factors will determine whether Bitcoin’s current consolidation phase becomes the foundation for the next major bull market.
Conclusion
Bitcoin’s market structure continues to evolve as institutional capital enters the ecosystem and new financial products reshape demand.
While the cryptocurrency has experienced significant price corrections since its 2025 peak, many analysts—including VanEck CEO Jan van Eck—believe the current environment represents a cyclical adjustment rather than a structural decline.
The traditional four-year halving cycle still appears to influence market behavior, but the rise of Bitcoin ETFs and institutional participation may be extending and stabilizing the cycle.
For investors focused on discovering the next wave of opportunities in the crypto industry, the coming months may represent a critical period.
If historical patterns hold true, Bitcoin may currently be entering the early stages of the next accumulation phase.
And if institutional demand continues to expand, the next cycle could push Bitcoin toward levels that once seemed impossible.
