
Main Points :
- Bitcoin’s weekly RSI has fallen below 30 for the first time in four years, signaling extreme oversold conditions.
- A sharp rebound followed last week’s plunge, but nearly half of that recovery has already been retraced.
- U.S. macro data—especially CPI and bond yields—are currently the dominant external drivers of price action.
- Mining difficulty has adjusted downward significantly, historically a late-cycle capitulation signal.
- On-chain metrics show mixed signals: stabilization in active addresses but cautious exchange flows.
- The $60,000 level remains a critical psychological and structural support zone.
- A softer CPI print could catalyze short covering and risk-on flows; a hot CPI may prolong volatility.
- For forward-looking investors, this phase may represent accumulation conditions rather than trend termination.
1. Market Context: From Sharp Rebound to Renewed Pressure
Bitcoin has entered a highly technical phase following a dramatic sell-off and equally dramatic rebound. According to analysis from Japanese exchange bitbank, BTC initially plunged before staging a powerful recovery of more than $10,000 in a single session. However, that rebound has since retraced approximately half its gains, placing the market back in a delicate consolidation zone.
In dollar terms, Bitcoin briefly reclaimed levels above $70,000 before failing to maintain momentum. It is now searching for support as macroeconomic crosscurrents intensify. While previous crypto cycles were largely driven by internal catalysts such as halvings or ETF approvals, this current phase appears tightly correlated with traditional financial variables—particularly U.S. labor data, Treasury yields, and inflation metrics.
The initial rebound was fueled by oversold conditions and short covering. However, renewed selling pressure emerged amid rising U.S. bond yields following stronger-than-expected employment data. Investors interpreted resilient labor markets as justification for prolonged restrictive monetary policy, pushing yields higher and compressing liquidity-sensitive assets such as Bitcoin.
2. The RSI Signal: A Four-Year Extreme
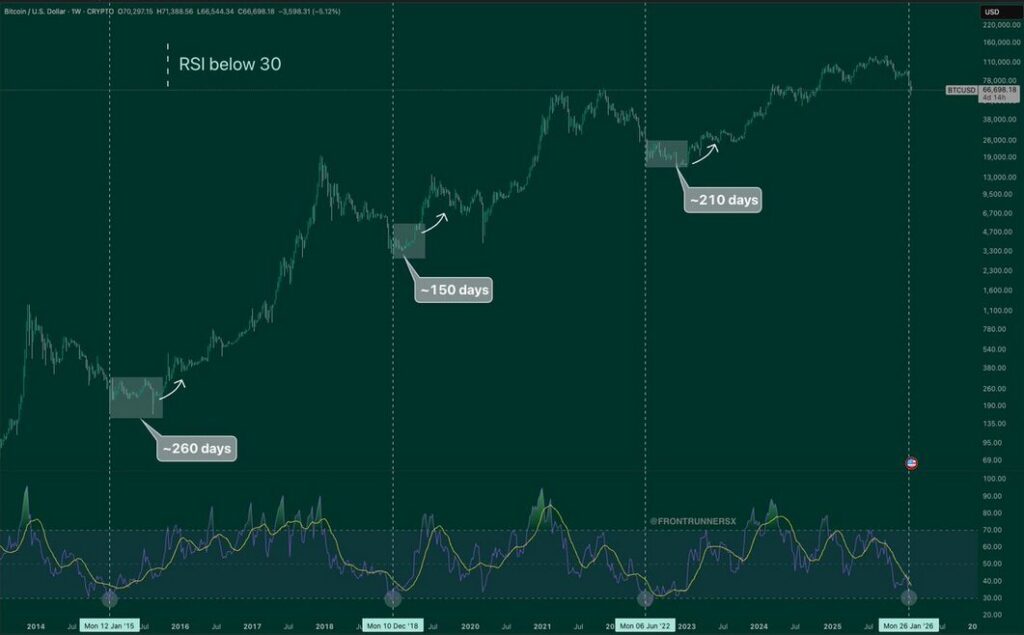
One of the most striking developments is Bitcoin’s weekly Relative Strength Index (RSI), which has fallen below 30 for the first time in four years. Historically, this threshold marks extreme oversold territory and often coincides with cyclical bottoms.
During prior cycles:
- 2018 bear market capitulation
- 2020 COVID liquidity crisis
- 2022 post-FTX deleveraging
Each instance of sub-30 weekly RSI preceded medium- to long-term recoveries. However, RSI alone does not guarantee immediate reversal; rather, it signals exhaustion of sellers and heightened probability of stabilization.
The current environment differs in that Bitcoin now trades within a far more institutionalized ecosystem. Spot ETF inflows, derivatives liquidity, and algorithmic trading amplify both drawdowns and rebounds. As such, oversold signals may result in sharp but temporary rallies before trend confirmation.
3. Mining Difficulty Adjustment: Capitulation or Structural Reset?
Another key development is the significant downward adjustment in Bitcoin mining difficulty. Mining difficulty reflects the computational effort required to secure the network. When price declines sharply, marginal miners become unprofitable, forcing hash rate reductions and difficulty adjustments.
Historically, major difficulty drops have occurred near market troughs. They signal stress within the mining ecosystem and often mark late-stage deleveraging. However, this cycle’s adjustment appears more measured rather than catastrophic.
Mining cost structures have evolved due to:
- Energy hedging strategies
- Geographic diversification
- Vertical integration of public mining firms
Therefore, while the difficulty decline reinforces capitulation narratives, it does not necessarily imply systemic fragility. Instead, it may represent a recalibration to a new equilibrium range.
4. On-Chain Metrics: Stabilization with Caution
Recent on-chain indicators provide a nuanced picture:
- Transaction counts remain steady on a monthly basis.
- Active addresses show stabilization rather than acceleration.
- Exchange inflows suggest selective profit-taking rather than panic liquidation.
This suggests that long-term holders are not aggressively distributing. Instead, short-term leveraged participants appear responsible for much of the volatility.
From a structural standpoint, the absence of large-scale exchange deposits is notable. In prior bear cycles, exchange inflows spiked dramatically during capitulation phases. Current flows remain contained, implying that structural holders maintain conviction.
5. The Macro Overhang: CPI as Immediate Catalyst
The most immediate catalyst is the U.S. Consumer Price Index (CPI) release. Inflation data directly influences Federal Reserve expectations. A softer CPI reading could lower bond yields, weaken the dollar, and support risk assets—including Bitcoin.
Conversely, an upside inflation surprise could extend yield strength and pressure liquidity-sensitive markets.
Current macro drivers affecting Bitcoin include:
- U.S. Treasury yield trajectory
- AI-sector equity volatility
- Institutional ETF flows
- Dollar index fluctuations
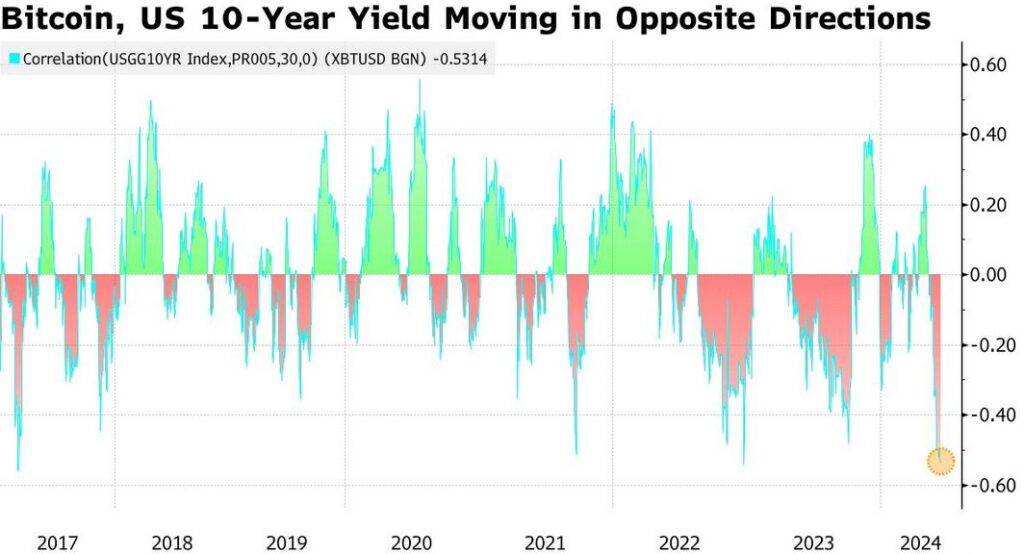
Bitcoin’s correlation with technology stocks has risen in recent quarters. Recent selling in AI-related equities has spilled into crypto markets, underscoring the cross-asset linkage.
6. Technical Structure: The $60,000 Battlefield
The $60,000 level stands as both psychological and structural support. Analysts suggest that even in the case of negative CPI surprises, strong buy-side interest is likely near this region due to:
- Oversold RSI
- Historical accumulation zones
- Institutional cost basis levels
However, sustained recovery requires reclaiming and holding above $70,000. Failure to do so risks extended range-bound volatility between $60,000 and $70,000.
[Bitcoin Weekly RSI (4-Year Context)]
7. Structural Capital Flows: ETF and Institutional Positioning
Institutional participation remains a defining feature of this cycle. Spot Bitcoin ETFs have introduced a persistent demand channel, though flows have moderated amid macro uncertainty.
Unlike prior cycles driven predominantly by retail leverage, current positioning reflects more diversified participation:
- Pension funds
- Hedge funds
- Sovereign wealth entities
- Corporate treasury allocations
This diversification may dampen extreme downside compared to past crypto winters. However, it also increases sensitivity to macroeconomic signals.
8. AI Sector Volatility and Cross-Market Contagion
Recent weakness in AI-focused equities has influenced crypto markets. As capital reallocates within the technology sector, liquidity rotations impact Bitcoin’s short-term direction.
While Bitcoin retains its narrative as “digital gold,” in practice it behaves as a high-beta macro asset during liquidity contractions. Therefore, equity market turbulence can amplify crypto volatility.
[BTC Price vs U.S. 10-Year Yield Correlation]
9. Strategic Outlook for Investors
For readers seeking new crypto assets or revenue streams, this phase offers strategic implications:
- Oversold conditions may favor staggered accumulation rather than lump-sum entries.
- Monitoring CPI and bond yields is essential for short-term positioning.
- Mining ecosystem stabilization could signal mid-term structural floor formation.
- Range trading strategies may outperform trend-following in current volatility.
Importantly, blockchain adoption continues regardless of price fluctuations. Institutional custody, cross-border settlement use cases, and tokenization initiatives remain active.
10. Conclusion: Capitulation or Compression Before Expansion?
Bitcoin stands at a technical and macroeconomic crossroads. The four-year RSI low and mining difficulty adjustment suggest exhaustion of sellers. Yet, macro headwinds—particularly elevated yields—temper optimism.
If CPI prints favor disinflation, a relief rally could quickly materialize. Should inflation surprise to the upside, volatility may persist but structural demand near $60,000 could absorb downside pressure.
For long-term investors, such compression phases historically precede expansionary cycles. For short-term traders, disciplined risk management remains paramount.
Bitcoin’s evolution into a macro-sensitive institutional asset does not negate its core properties. Rather, it reflects maturation. Whether this marks a cyclical bottom or an extended consolidation, the coming inflation data may define the next major move.
