
Main Points :
- Bitcoin’s current price action closely mirrors the 2022 bear market rally rather than a confirmed bull market breakout
- The 365-day moving average (365D MA) around $101,000 is acting as a critical structural resistance
- On-chain data suggests rising selling pressure, especially from increased BTC inflows to exchanges
- Market psychology today resembles the premature optimism seen during past bear market rallies
- Until Bitcoin decisively reclaims and holds above the 365D MA, downside risk remains elevated
Introduction: Why This Rally Feels Familiar
Bitcoin (BTC) has once again captured market attention after rebounding more than 20% from its recent lows. To many participants, this recovery appears to signal renewed strength and the possible resumption of a long-term bull market. However, a growing body of on-chain and technical evidence suggests a far less comforting interpretation.
According to a recent weekly report from on-chain analytics platform CryptoQuant, Bitcoin’s current market structure in early 2026 bears a striking resemblance to the infamous 2022 bear market rally. At that time, multiple sharp rebounds convinced investors that the worst was over—only for the market to resume its downward trajectory shortly thereafter.
The central warning is clear: as long as Bitcoin remains below approximately $101,000, the broader market remains vulnerable to further downside.
Bitcoin’s Recent Price Action: A 21% Rebound, But From Where?
Since November 21, Bitcoin has risen approximately 21%, recovering from a local low near $80,500. On the surface, this performance appears impressive. Yet context matters.
CryptoQuant emphasizes that such rebounds are not unusual during bear markets. In fact, they are a defining feature. These rallies often occur as short-covering, bargain-hunting, and narrative-driven optimism temporarily overpower underlying weakness.
In 2022, Bitcoin experienced multiple rallies exceeding 25% and even 40%, all while remaining firmly within a broader bearish structure.
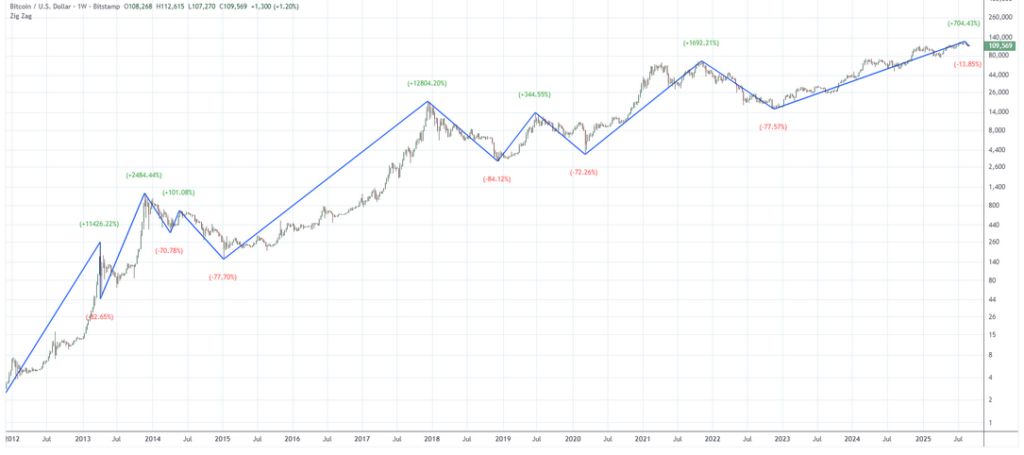
The 365-Day Moving Average: The Market’s Ultimate Reality Check
The most critical technical level highlighted in the report is the 365-day moving average (365D MA), currently hovering near $101,000.
This indicator is widely regarded as a long-term trend filter:
- Above the 365D MA → structurally bullish market
- Below the 365D MA → structurally bearish market
CryptoQuant notes the following sequence:
- Bitcoin fell below the 365D MA, confirming entry into a bear market
- The price subsequently declined approximately 19%
- A rebound of roughly 19% followed
- Bitcoin is now approaching the same 365D MA from below
This pattern is not only concerning—it is historically familiar.
Historical Parallel: The 2022 Blueprint Repeating Itself
CryptoQuant draws a direct comparison with 2022:
- After losing the 365D MA, Bitcoin dropped roughly 27%
- It then staged a powerful 47% rally, convincing many that a new bull cycle had begun
- Ultimately, the price was rejected at the 365D MA and resumed its decline
What makes the current situation particularly notable is that the price trajectory of 2026 aligns more closely with 2022 than with the 2018 bear market, suggesting a structurally similar environment rather than a cyclical bottom.
【BTC/USD Daily Chart Comparison (2022 vs. 2026)】
Overlay comparison highlighting the similarity in price structure around the 365-day moving average
On-Chain Warning Signal: Rising Bitcoin Inflows to Exchanges
Beyond price action, on-chain data adds another layer of caution.
CryptoQuant reports that Bitcoin inflows to exchanges have surged to approximately 39,000 BTC on a 7-day moving average, the highest level observed since November 25, 2025.
Historically, increased BTC inflows to exchanges correlate with:
- Heightened intent to sell
- Profit-taking during relief rallies
- Preparation for increased market volatility
This does not guarantee immediate selling pressure, but it significantly raises the probability.
【Bitcoin Exchange Inflows (7-Day Moving Average)】
Rising BTC inflows as a leading indicator of potential selling pressure
Market Psychology: Déjà Vu of Premature Optimism
One of the most striking elements of CryptoQuant’s report is not technical—it is psychological.
In 2022, widespread narratives emerged:
- “The bear market is over”
- “The four-year cycle is broken”
- “A supercycle has begun”
Sound familiar?
CryptoQuant argues that current market sentiment mirrors this same premature optimism, despite fundamental and technical indicators still pointing to a bear market regime.
This mismatch between narrative and data is often observed near the midpoint of bear markets rather than at their end.
Why This Matters for Investors Seeking New Crypto Opportunities
For readers interested in discovering new crypto assets, yield strategies, or practical blockchain applications, this analysis carries important implications:
- Capital preservation matters more than aggressive allocation during structurally bearish phases
- Short-term rallies can create tactical opportunities, but they should not be mistaken for long-term trend reversals
- On-chain data provides early warnings that price alone cannot
This environment favors disciplined risk management, selective exposure, and strategies that generate yield independent of directional price appreciation.
Macro Context: Why Structural Confirmation Matters More Than Speed
Even if Bitcoin ultimately resumes a long-term bull market, history suggests that true trend reversals are slow, uneven, and confirmed structurally—not emotionally.
A decisive reclaim of the 365D MA, accompanied by declining exchange inflows and improving on-chain fundamentals, would significantly change the risk profile. Until then, caution remains justified.
Conclusion: $101,000 Is Not Just a Number—It’s a Line Between Hope and Confirmation
Bitcoin’s current rally is undeniably strong. Yet strength alone does not define a bull market.
The convergence of technical resistance at the $101,000 level, rising exchange inflows, and historical parallels to 2022 paints a picture that demands restraint rather than euphoria.
For investors and builders alike, this phase is best viewed not as a green light—but as a testing ground. Those who respect structure, data, and historical precedent are far more likely to survive—and thrive—when the next confirmed cycle truly begins.
