Main Points :
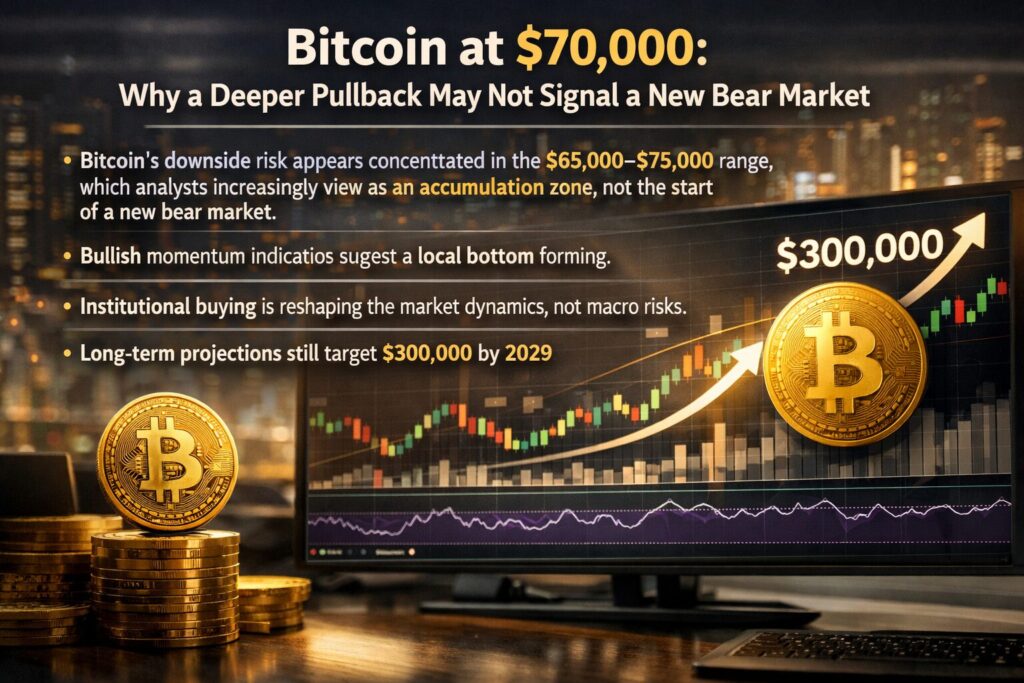
- Bitcoin’s downside risk appears concentrated in the $65,000–$75,000 range, which analysts increasingly view as a structural accumulation zone rather than the start of a new bear market.
- Momentum indicators, particularly the 3-day bullish divergence and RSI oversold conditions, suggest the potential formation of a local bottom.
- Unlike past drawdowns, the current correction reflects supply rotation from early holders to institutions, not systemic macro risk.
- Traditional four-year halving cycles are losing dominance, replaced by longer liquidity and debt cycles extending potentially into 2026 and beyond.
- Slower cycles may imply lower volatility but still strong long-term returns, with long-term models projecting upside scenarios toward $300,000 by 2029.
Introduction: Fear Returns as Bitcoin Tests Key Levels
Bitcoin’s recent price weakness has reignited investor anxiety, with market participants questioning whether a drop toward $70,000 — or even lower — marks the beginning of a new bearish phase. Headlines emphasizing downside risk often trigger memories of 2022’s brutal drawdown or the sharp corrections seen in early 2024.
However, a growing group of macro and crypto-native analysts argue that this interpretation may be fundamentally flawed. Rather than signaling a renewed bear market, the current price action appears more consistent with a mid-cycle consolidation within a structurally bullish regime.
This distinction matters greatly for investors, builders, and institutions seeking long-term exposure to Bitcoin and the broader digital asset economy. Understanding whether this move represents systemic weakness or constructive digestion can shape portfolio strategy, treasury management, and even product development decisions across the blockchain industry.
Supply Rotation, Not Systemic Stress
One of the most important differences between the current drawdown and past bear markets lies in who is selling — and why.
Crypto trader Jackis describes the current environment as a macro range-bound market within the broader 2025 structure. Even if Bitcoin revisits $70,000, he argues, the move bears little resemblance to prior bear cycles. In 2022, price declines were driven by aggressive monetary tightening, collapsing leverage, and cascading insolvencies. In early 2024, ETF-related flows and speculative excess created sharp but unstable moves.
By contrast, today’s selling pressure reflects supply rotation. Long-term holders and early adopters are gradually transferring coins to institutional investors, ETFs, and corporate treasuries. This process naturally creates periods of price compression without implying structural weakness.
From a market structure perspective, this is a sign of maturation, not decay. Bitcoin is increasingly behaving like a global macro asset, where large reallocations take time and produce sideways or corrective price action rather than vertical collapses.
Technical Signals: The Case for a Local Bottom
From a technical standpoint, several indicators are reinforcing the idea that downside risk may be limited.
3-Day Bullish Divergence
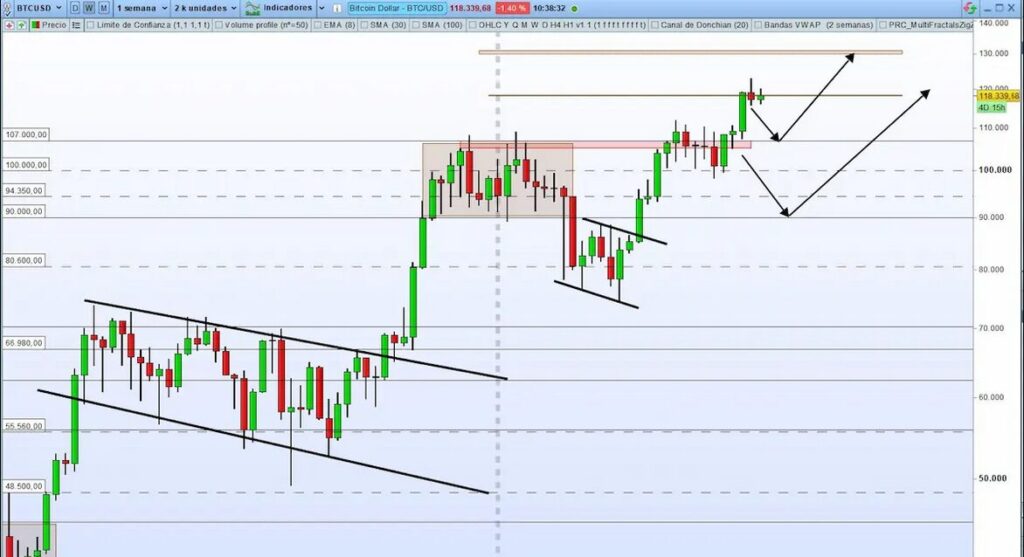
Market analyst Jelle highlights the potential formation of a bullish divergence on the 3-day chart, a pattern that has historically coincided with local bottoms during this cycle. In previous instances, when momentum stabilized after divergence confirmation, Bitcoin entered renewed upward phases.
That said, Jelle cautions that such signals require time and consolidation. Divergences often form over weeks, not days, and premature conclusions can lead to false starts.
[Bitcoin 3-Day Chart Showing Bullish Divergence Formation]
Oversold Conditions and RSI Behavior
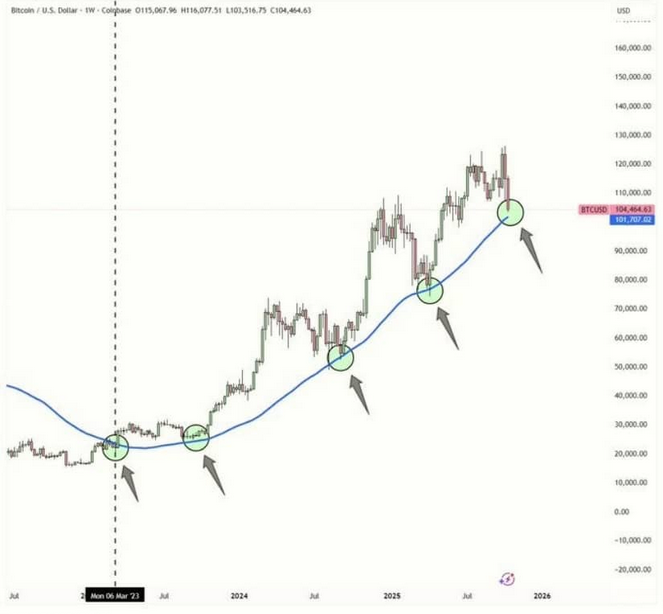
Macro analyst Julien Bittel, Head of Macro Research at Global Macro Investor, adds further support by examining Bitcoin’s behavior after the Relative Strength Index (RSI) falls below 30 — a classic oversold signal.
Historically, when Bitcoin enters such oversold territory, it rarely transitions directly into a sustained bear market. Instead, price tends to follow a choppy basing process, characterized by volatility, false breakdowns, and extended consolidation. Only after this base forms does a durable uptrend typically resume.
Bittel emphasizes that this process can be psychologically challenging. Markets feel unstable near bottoms precisely because uncertainty is highest. Yet from a probabilistic standpoint, these zones often offer asymmetric long-term opportunity rather than existential risk.
[Bitcoin Price Path Following RSI Below 30]
The End of the Simple Four-Year Cycle?
Another crucial insight from Bittel is his assertion that Bitcoin’s traditional four-year halving cycle is no longer the dominant price driver.
In Bitcoin’s early history, halving-induced supply shocks played an outsized role. Today, however, Bitcoin exists within a complex global liquidity system. Sovereign debt refinancing cycles, central bank balance sheets, and cross-border capital flows increasingly outweigh mechanical issuance reductions.
As a result, Bitcoin’s current market structure may persist well into 2026, driven by macro liquidity conditions rather than simple calendar-based cycles. For investors, this implies fewer explosive blow-off tops — but also fewer catastrophic collapses.
Fidelity’s Perspective: Long Cycles, Strong Returns
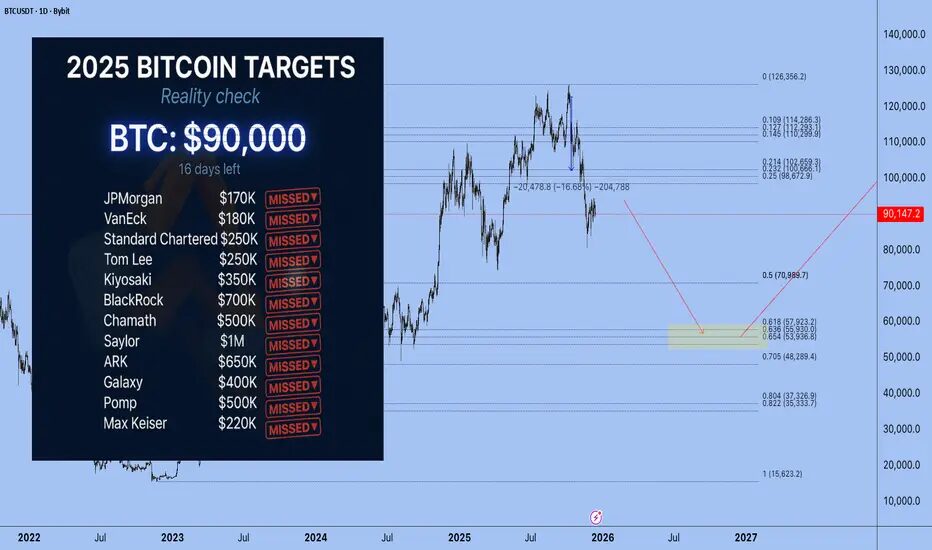
Jurrien Timmer, Director of Global Macro at Fidelity, places the current phase within a broader wave structure spanning 2022 to 2025. According to his analysis, Bitcoin has already delivered a compound annual growth rate (CAGR) of approximately 105% over 145 weeks, aligning closely with long-term regression models.
Timmer acknowledges that deeper consolidation into the $65,000–$75,000 range is possible. Importantly, he frames this zone not as a danger area, but as a historically strong demand region, where long-term buyers have consistently emerged.
[Bitcoin Wave Structure and Price Target Analysis]
Slower Adoption Curves, Higher Stability
Looking further ahead, Timmer expects future Bitcoin cycles to become less steep as adoption broadens. Institutional ownership, regulatory clarity, and integration into payment, custody, and settlement systems all contribute to dampening volatility.
Yet slower cycles do not necessarily imply lower returns. Price models incorporating adoption curves suggest that if Bitcoin enters another expansionary phase, long-term targets near $300,000 by 2029 remain plausible.
For builders and investors focused on real-world use cases — payments, treasury management, tokenized assets, and settlement infrastructure — this environment may be healthier than the speculative manias of earlier cycles.
What This Means for Investors and Builders
From a strategic standpoint, the current correction offers several important lessons:
- For investors: Volatility near support zones should be viewed through a multi-year lens, not short-term emotion.
- For institutions: Gradual accumulation during consolidation aligns with fiduciary risk management.
- For builders: Extended cycles create space to develop products without the pressure of bubble-driven timelines.
- For emerging crypto assets: Capital rotation during Bitcoin consolidation often precedes renewed interest in infrastructure, payments, and yield-generating protocols.
In other words, the absence of euphoria may actually be a sign of structural health.
Conclusion: Consolidation as a Foundation, Not a Failure
A decline toward $70,000 may feel uncomfortable, but discomfort alone does not define a bear market. The weight of evidence — from supply dynamics and technical indicators to macro cycle analysis — suggests that Bitcoin is undergoing a constructive consolidation, not a systemic breakdown.
As Bitcoin matures into a global monetary asset, its cycles are becoming longer, smoother, and more complex. For those willing to look beyond short-term price noise, this phase may represent the groundwork for Bitcoin’s next structural advance — one built on adoption, liquidity, and long-term conviction rather than speculative excess.
