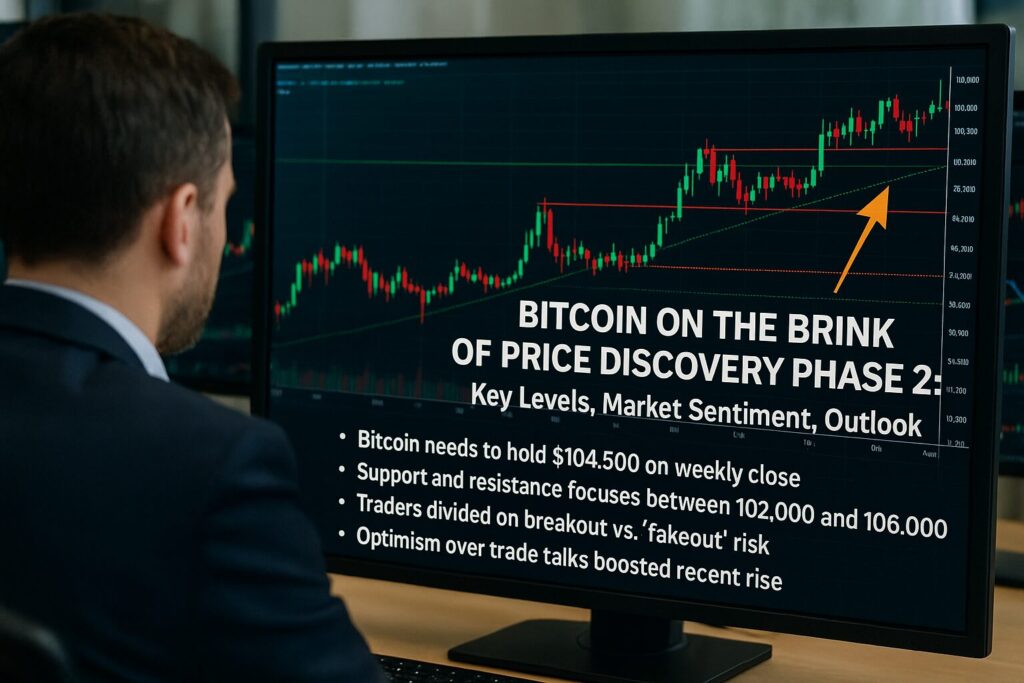
Main Points:
- Bitcoin must hold above $104,500 on the weekly close to validate a move into “Price Discovery Phase 2.”
- Liquidity clusters around the $102,000–$106,000 zone highlight critical support and resistance levels.
- Divergent trader views point to both a potential breakout toward new all-time highs and a fakeout risk.
- Macro tailwinds—namely a U.S.–U.K. trade deal and optimistic U.S.–China talks—have fueled recent upside.
- Bitcoin dominance has plateaued near 65%, suggesting altcoins may begin to outperform.
- Institutional sentiment is mixed: ETF flows remain subdued even as price rallies, indicating cautious large-scale participation.
Introduction
In mid-May 2025, Bitcoin (BTC) has once again commanded headlines by flirting with, and briefly breaking above, the $105,000 mark. According to data from Cointelegraph Markets Pro and TradingView, weekend out-of-hours trading saw volatility surge, driving BTC to multimonth highs just shy of $105,000. This move comes at a pivotal juncture: many analysts argue that for Bitcoin to truly embark on the next leg of its bullish cycle—what some term “Price Discovery Phase 2”—it must end the weekly candle above the critical $104,500 threshold.
At its core, “Price Discovery Phase 2” refers to a stage wherein Bitcoin breaks decisively above its previous all-time high, establishing a new trading range and rapidly accelerating toward uncharted price territory. As the flagship cryptocurrency grapples with key levels, market participants are closely watching liquidity zones, trader sentiment, macroeconomic developments, and on-chain metrics to gauge whether the recent rally has the momentum to sustain fresh record highs or will falter in a classic “fakeout.”
Current Market Context
Bitcoin’s surge past $100,000 on May 9 marked a psychological milestone, the first since early February, thanks in part to renewed optimism over a U.S.–U.K. trade agreement and rumor-driven buoyancy around upcoming U.S.–China trade talks. After a price slide from late January’s $108,300 high down to sub-$96,000 levels in April, BTC has rallied over 10% year-to-date and nearly 40% from its April lows.
However, beneath the headline figure lies nuance: trading volumes on major venues like Coinbase have not matched price gains, hinting that institutional players may be pacing their entries or sitting on the sidelines. This dichotomy—strong price action in an environment of muted volume—raises questions about the durability of the breakout and whether retail-driven momentum can be sustained.
Technical Analysis and Key Levels
Critical Support: $102,000–$104,500
Order-book data from platforms such as CoinGlass shows dense clusters of buy orders ramping up from roughly $102,000 to $104,500. Analysts pinpoint $104,500 as the linchpin: sustaining this level through the weekly close would flip prior resistance into a support base for a definitive breakout.
Supply Wall: $105,000–$106,000
Conversely, a formidable wall of sell orders sits just below $106,000, representing profit-taking ambitions from traders who scaled in at lower levels. Breaking through this ceiling could open the path to re-test Bitcoin’s late-January all-time high (~$108,300) and beyond.
Fibonacci and Moving Averages
From a traditional technical standpoint, reclaiming and holding above the 200-week moving average—which hovers near $100,000—underscores a shift in medium-term bias from neutral to bullish. A weekly close north of $104,500 would confirm that momentum has decisively tilted in favor of buyers.
Trader Sentiment and Risks
Despite bullish charts, not all participants are convinced the rally will stick. Popular X (formerly Twitter) trader HTL-NL warns of a potential “fakeout,” where the breakout fails and traps overleveraged long positions, triggering a sharp retracement within the current range. Similarly, the pseudonymous Il Capo of Crypto advises caution, suggesting that if this rally is merely a mid-cycle correction against a downtrend that began in January, Bitcoin could unwind gains entirely before staging any sustained uptrend.
Rekt Capital, however, remains optimistic, affirming that Bitcoin stands on the verge of its second wave of price discovery—provided it holds the support line at $104,500 into the weekly close Cointelegraph. According to his “Bull Market Progress” metric, the current cycle is already 85.5% complete, with parabolic advances still possible.
Macro Factors and On-Chain Metrics
Trade Deals and Liquidity Windows
The immediate catalyst for the recent run was a combination of positive U.S.–U.K. trade deal headlines and speculative chatter about renewed U.S.–China negotiations. These macro tailwinds tend to favor risk assets like Bitcoin, especially during off-peak liquidity windows where thinner order books exacerbate price swings.
On-Chain Indicators
On-chain data paints a complementary picture: exchange reserves continue a downward trend, indicating reduced selling pressure, while the number of active addresses has climbed modestly, suggesting renewed user engagement. That said, network transaction fees remain subdued compared to prior all-time high periods, implying that on-chain activity has yet to fully revitalize.
Institutional Interest and ETF Dynamics
While price action has been robust, institutional engagement—particularly via Bitcoin ETFs—has been comparatively tepid. Recent reports note that ETF inflows have stagnated despite the price rally, a warning sign that large money managers are remaining cautious amid regulatory uncertainty and profit-taking thresholds around $105,000.
In contrast, ancillary products such as Grayscale’s Bitcoin Trust have seen a slight uptick in demand, though this has not translated into broad-based institutional accumulation. Until ETF flows pick up sustainably, the onus for continued upside may rest on retail and derivative-driven leverage rather than patient, long-term capital.
Meanwhile, Bitcoin’s market dominance—its share of total crypto market capitalization—has held steady near 65%, still below cycle highs of 74%. This suggests that altcoin cycles could begin accelerating, as capital rotates into lower-cap projects once Bitcoin momentum plateaus.
Understanding “Price Discovery Phase 2”
“Price Discovery Phase 2” is characterized by Bitcoin transcending its prior all-time high and rapidly establishing a new price regime. In Phase 1, Bitcoin consolidates within a range beneath its record high, building liquidity and “absorbing” sellers. A decisive weekly close above that range’s ceiling signals entry into Phase 2, where the path of least resistance is upward, and price can “discover” higher valuations with limited historical resistance.
Key prerequisites:
- Weekly Close Above Resistance: Securing the weekly candle over $104,500.
- Volume Confirmation: Sustained uptick in both spot and ETF volumes.
- Reduced Exchange Reserves: Continued outflows from exchanges.
- Macro Stability: No abrupt reversal in risk appetite due to geopolitical or monetary policy shocks.
Potential Scenarios
Bullish Breakout
- Trigger: Weekly close > $104,500 with volume surge.
- Target: Initial nod toward $120,000–$125,000, extrapolating prior consolidation measured moves and Fibonacci extensions.
- Drivers: Accelerating ETF flows, institutional buys, risk-on macro sentiment.
Range Bound / Fakeout
- Trigger: Failure to hold weekly support at $104,500.
- Retracement: Pullback into $95,000–$100,000 zone, possibly as low as $92,000, where multiple technical supports converge.
- Risk: Forced liquidations in overleveraged derivative positions, exacerbating volatility.
Gradual Ascend
- Trigger: Moderate hold of key levels without immediate breakout.
- Path: Sideways consolidation between $100,000 and $106,000, building base for next institutional push.
Practical Implications for Investors
- Position Sizing: Use tiered entries around support ($102,000–$104,500) to manage risk.
- Leverage: Exercise caution around liquidations; avoid overleveraging into supply walls.
- Diversification: Monitor altcoin cycles as Bitcoin dominance plateaus—consider selective allocation to high-conviction projects.
- Macro Monitoring: Keep an eye on trade-talk developments and U.S. policy shifts that could abruptly flip risk sentiment.
Conclusion
Bitcoin’s recent flirtation with $105,000 has reignited hopes of surging beyond its all-time high into a bona fide “Price Discovery Phase 2.” Critical to this narrative is Bitcoin’s ability to close the weekly candle above $104,500, thereby flipping a formidable resistance into fresh support. While macro tailwinds from trade-deal optimism and technical indicators from on-chain metrics offer compelling catalysts, volume divergence and cautious institutional appetite temper unbridled bullishness.
Ultimately, the coming days will test whether Bitcoin can sustain its momentum, break free of multi-month consolidation, and navigate the dense liquidity clustered around its current price. Investors should prepare for both scenarios—a genuine breakout toward new heights and a potential fakeout that erases recent gains. Prudent risk management and an eye on evolving macro and market-structure cues will remain paramount as Bitcoin charts its next course.

