Key Points :
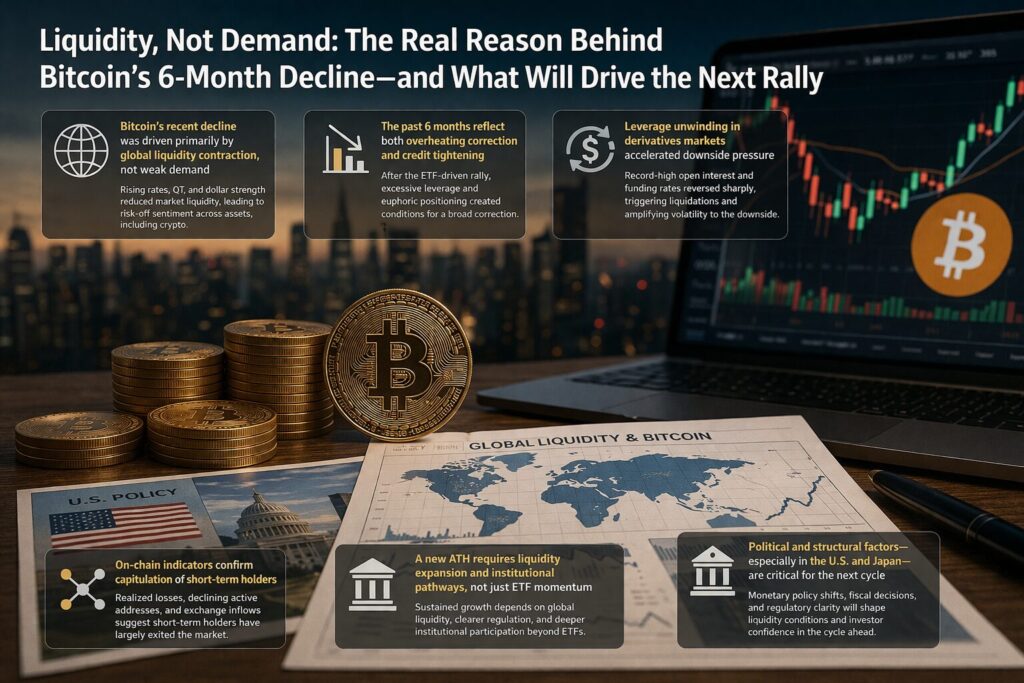
- Bitcoin’s recent decline was driven primarily by global liquidity contraction, not weak demand
- The past 6 months reflect both overheating correction and credit tightening
- Leverage unwinding in derivatives markets accelerated downside pressure
- On-chain indicators confirm capitulation of short-term holders
- A new ATH requires liquidity expansion and institutional pathways, not just ETF momentum
- Political and structural factors—especially in the U.S. and Japan—are critical for the next cycle
1. Introduction: Beyond Price—Understanding the Structure of the Market
Bitcoin’s recent stabilization has triggered growing optimism that the market may have found a bottom. Indeed, short-covering rallies and reduced selling pressure suggest a temporary equilibrium. However, focusing solely on price misses the deeper structural story.
To understand what lies ahead, we must analyze what truly caused the past six months of decline—and more importantly, what conditions are required for Bitcoin to reach new all-time highs (ATHs).
The answer is not demand.
It is liquidity.
2. Bitcoin as the “Terminal Asset” of Global Liquidity
Bitcoin is often misunderstood as a purely demand-driven asset. In reality, it sits at the far end of a hierarchical capital flow system:
Central Bank Liquidity → Bonds → Equities → Crypto Assets
This means Bitcoin is the last recipient of global capital flows. When liquidity expands, excess capital eventually reaches crypto. When liquidity contracts, Bitcoin is among the first to suffer.
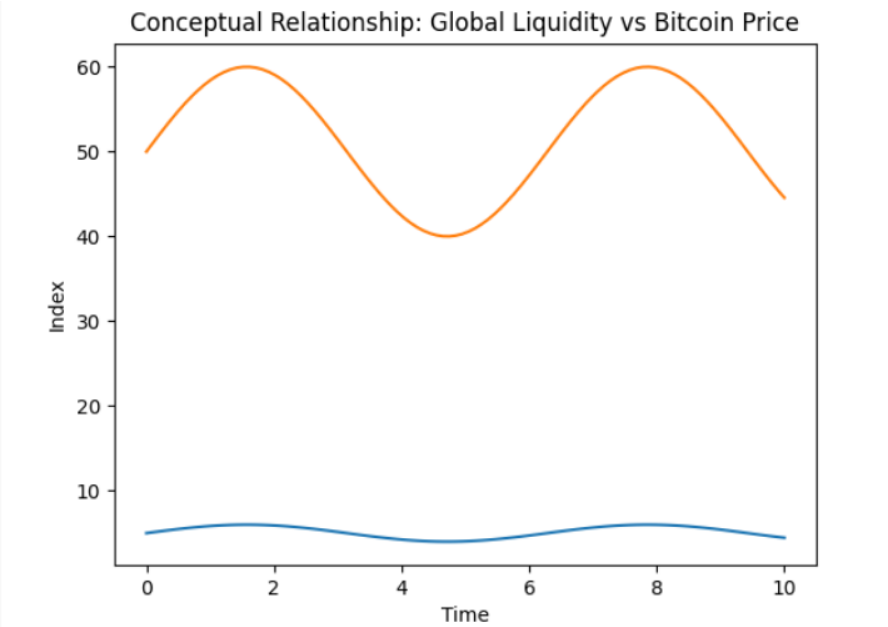
This conceptual relationship illustrates how Bitcoin price movements closely follow global liquidity cycles.
3. The Macro Shift: Why Liquidity Contracted
Over the past six months, several macroeconomic shifts converged:
- Persistently high U.S. interest rates
- Strong U.S. dollar (USD appreciation)
- Rising Japanese government bond (JGB) yields
These factors collectively triggered a global tightening of financial conditions.
The Japan Factor (Underrated but Critical)
Japan plays a unique role as one of the world’s largest external investors. Through the yen carry trade, Japanese capital has historically provided liquidity to global markets.
However, rising domestic yields weakened this mechanism:
- Japanese investors repatriated funds
- Overseas asset allocation declined
- Global liquidity supply shrank
This directly impacted Bitcoin—not because people stopped wanting it, but because capital stopped reaching it.
4. Credit Contraction and the Leverage Unwind
Liquidity contraction alone does not explain the full decline. The second layer is credit tightening, particularly in derivatives markets.
Crypto markets had accumulated significant leverage:
- High open interest in perpetual futures
- Overexposure to long positions
- Retail and institutional leverage stacking
When prices began to fall, this triggered a cascade:
- Liquidations of long positions
- Forced selling
- Feedback loops driving further decline
This is a classic deleveraging cycle, where future demand (leveraged buying) is pulled forward and then erased.
5. On-Chain Evidence: Signals of Market Stress
On-chain metrics provide strong confirmation of this structural stress.
5.1 STH-SOPR (Short-Term Holder SOPR)
This metric measures whether short-term holders are selling at a profit or loss.
- Below 1 → selling at a loss (capitulation)
- Above 1 → selling at profit (healthy demand)
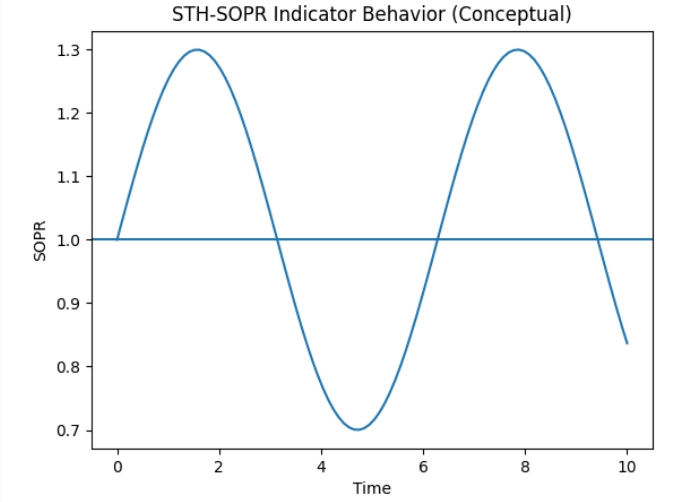
Over the past months, SOPR remained below 1, indicating:
- Panic selling
- Weak market confidence
- Ongoing absorption of losses
A sustained recovery above 1 would signal trend reversal.
5.2 Coinbase Premium Gap
This indicator measures price differences between U.S. exchanges and global markets.
- Positive → U.S. buying pressure
- Negative → weak institutional demand
Recent trends show persistent negative territory, suggesting:
- Lack of strong U.S. spot demand
- Institutional hesitation
6. The Misconception: ETFs Alone Cannot Drive ATH
There is a growing narrative that Bitcoin ETFs will automatically push prices higher.
This is incomplete.
ETFs are merely access channels, not sources of liquidity themselves.
Without underlying capital expansion, ETFs simply redistribute existing capital rather than introducing new inflows.
7. What Actually Drives the Next Bull Market
The path to a new ATH depends on one core condition:
Can liquidity flow back to the “edge” of the system—where Bitcoin sits?
7.1 U.S. Political and Monetary Policy
Upcoming U.S. elections will influence:
- Fiscal expansion
- Monetary easing pressure
- Regulatory clarity
If policies shift toward:
- Lower interest rates
- Increased government spending
Then global liquidity will expand again—fueling risk assets.
7.2 Japan’s Structural Role
A potential approval of a Bitcoin ETF in Japan could be transformative.
Japan holds approximately:
- ~$14 trillion equivalent in household financial assets
If even a small portion reallocates into crypto via traditional brokerage channels, this would:
- Create new capital inflow routes
- Expand the investor base
- Reduce access barriers
This is not just demand—it is infrastructure for liquidity transmission.
8. Structural Shift: From Speculation to Capital Flow Engineering
The next phase of Bitcoin’s evolution is not purely speculative.
It is about:
- Financial infrastructure
- Regulatory integration
- Institutional capital routing
Markets are transitioning from retail-driven hype cycles to macro-driven liquidity cycles.
9. Conclusion: Follow the Money, Not the Price
The past six months were not a failure of Bitcoin demand.
They were a reflection of:
- Liquidity contraction
- Credit tightening
- Structural capital withdrawal
The next rally will not be triggered by:
- Technical patterns
- Retail sentiment
- ETF headlines alone
Instead, it will depend on:
- Global liquidity expansion
- Institutional access channels
- Policy-driven capital flows
In Bitcoin markets, price is the result—not the cause.
The real signal lies in the movement of capital.