Key Points :
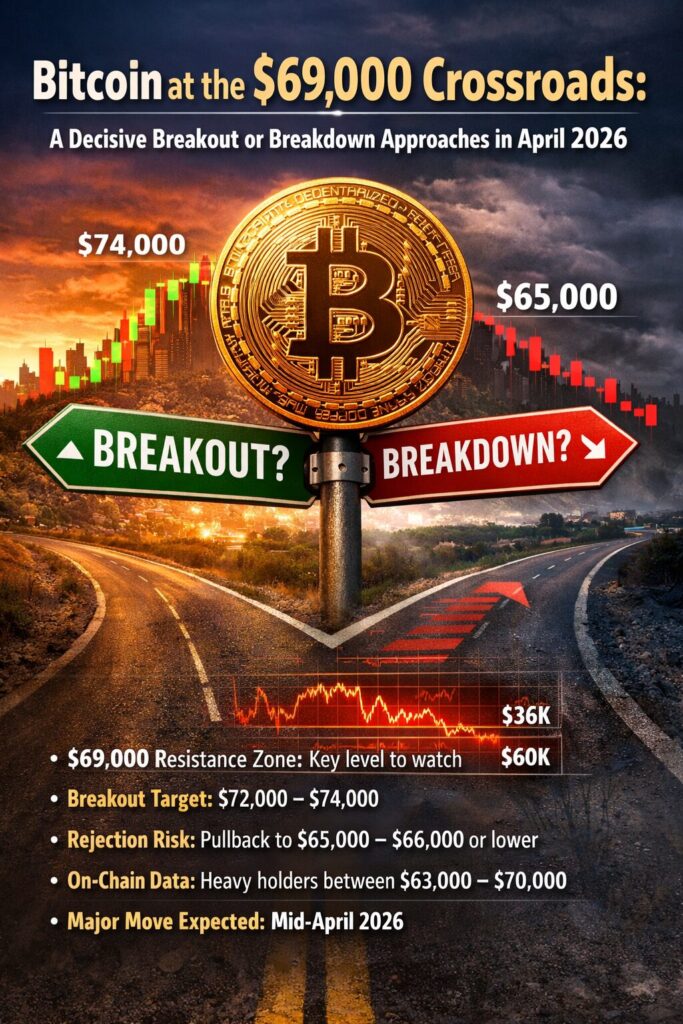
- Bitcoin is approaching a critical resistance zone at $69,000–$70,000
- A breakout could push BTC toward $72,000–$74,000
- A rejection could trigger a pullback to $65,000–$66,000, or lower
- On-chain data (URPD) shows heavy holder concentration between $63,000–$70,000
- Historical patterns suggest a major move around mid-April 2026
- Downside indicators point to deeper support zones between $36,000–$60,000
- Institutional factors and regulatory shifts may influence direction
1. The $69,000 Resistance: A Market Dividing Line

Over the past two months, Bitcoin has been locked in a broad consolidation range between approximately $62,000 and $74,000. This range reflects a market caught between strong macro tailwinds and equally strong profit-taking pressure.
As of early April 2026, BTC has once again approached the $69,000–$70,000 resistance zone, a level that has repeatedly rejected upward momentum. This price region is not merely a technical ceiling—it represents a psychological battleground where market participants must decide whether Bitcoin is ready for its next leg upward or due for a correction.
If Bitcoin successfully breaks above this resistance with strong volume, analysts anticipate a move toward $72,000–$74,000, effectively retesting the upper boundary of the broader range. Such a move would likely trigger renewed bullish sentiment and possibly attract momentum-driven capital.
However, failure to break through this level could result in a pullback toward the $65,000–$66,000 support zone, where buyers have previously stepped in. This creates a classic “decision point” scenario, where risk-reward dynamics are sharply defined.
2. The Mid-April Turning Point: Timing the Breakout
One of the most compelling aspects of the current market structure is its timing. Historical analysis shows that major Bitcoin rallies are often preceded by extended periods of sideways consolidation lasting 8–15 weeks.
As of April 7, 2026, the current consolidation phase has entered its 9th week, placing it squarely within this historical window. Previous instances of similar behavior have consistently led to significant volatility expansions—either upward or downward.
This suggests that mid-April 2026 could mark a decisive turning point, where Bitcoin exits its current range and establishes a new trend.
However, not all analysts are optimistic. Some argue that the longer a market consolidates without breaking upward, the greater the likelihood of a downward resolution due to weakening momentum and distribution by large holders.
3. URPD and the “No-Trade Zone” Effect
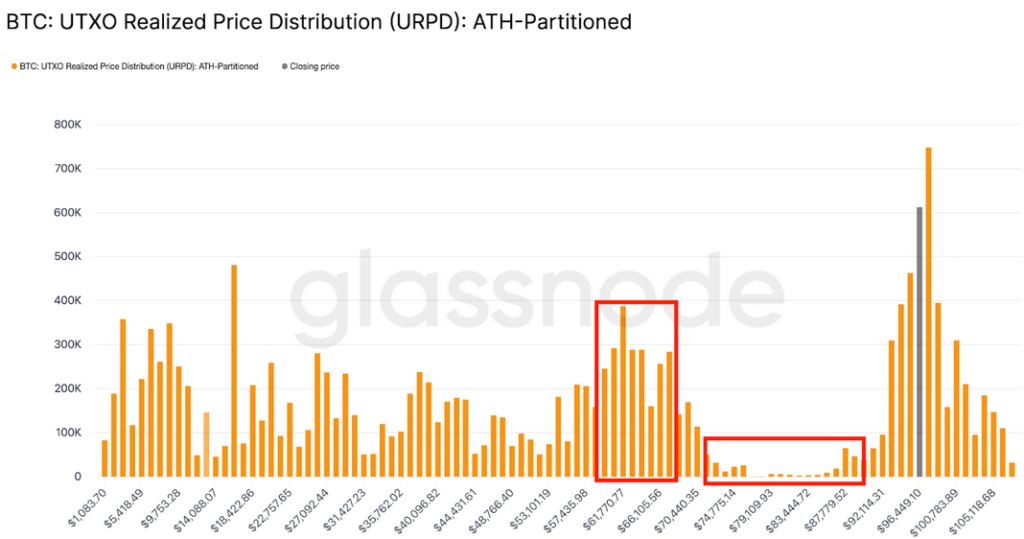
On-chain data provides deeper insight into why Bitcoin is struggling to break higher.
The UTXO Realized Price Distribution (URPD) shows that a significant portion of Bitcoin supply was last moved within the $63,000–$70,685 range. This means that a large number of holders have their cost basis in this zone.
This creates two important dynamics:
- Support Formation
Investors who bought in this range are incentivized to defend their positions, creating a natural price floor. - Resistance Amplification
At the same time, many holders may choose to exit at breakeven, increasing selling pressure and reinforcing resistance.
The result is what analysts call a “No-Trade Zone”—a price region where buying and selling forces neutralize each other, leading to stagnation.
Breaking out of this zone requires significant external capital inflows or strong catalysts, such as institutional buying or macroeconomic shifts.
4. Historical Patterns: Calm Before the Surge
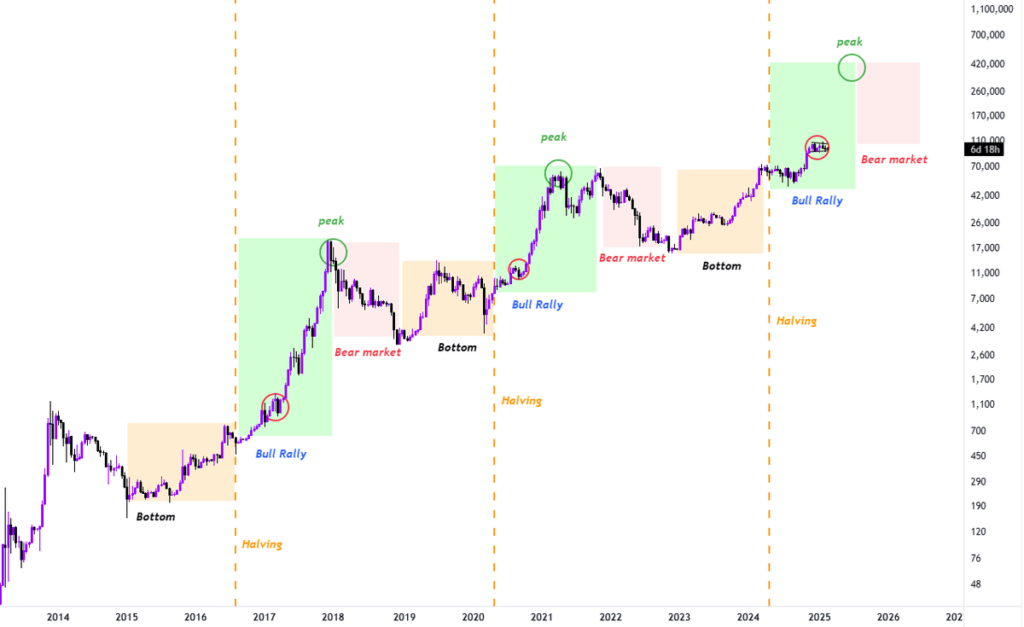
Another key observation is that Bitcoin’s major rallies have historically been preceded by periods of low volatility and sideways movement.
In the last four major bullish cycles:
- Each rally was preceded by 8–15 weeks of consolidation
- Volatility compressed before expanding rapidly
- Breakouts were often sudden and decisive
The current structure mirrors these past setups closely. However, history does not guarantee direction—it only suggests that a large move is imminent.
Importantly, some analysts warn that the next move could be downward, especially if macro liquidity tightens or if risk assets face broader selling pressure.
5. Downside Scenarios: Where Is the Real Bottom?
While much attention is focused on a potential breakout, it is equally important to consider downside scenarios.
Several key support levels have been identified:
Primary Support Zone
- $65,000–$66,000
Immediate support if resistance holds
Macro Trendline Support
- $56,000–$60,000
Long-term uptrend line since 2017
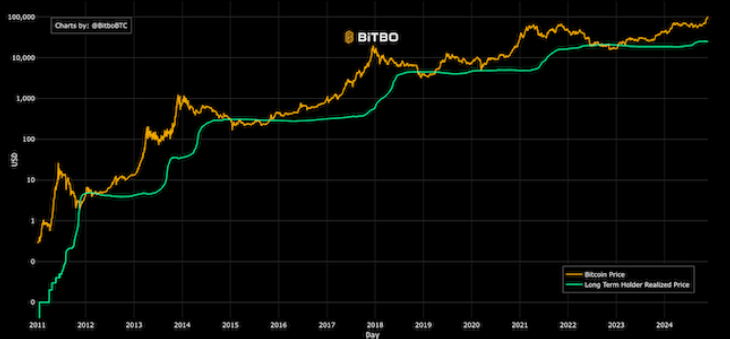
On-Chain Valuation Levels
- CVDD: ~$47,960
- MVRV (0.8 band): ~$43,647
- Long-Term Holder Realized Price: ~$49,387
These levels represent areas where Bitcoin has historically found strong demand.
Extreme Bear Case (“Generational Opportunity”)
- Around $36,657
This level, based on statistical deviation models, is considered a once-in-a-generation buying opportunity, though reaching it would likely require a significant macro shock.
6. Institutional Forces and Market Structure Evolution
Beyond technicals and on-chain metrics, the broader market environment is evolving.
Recent developments include:
- Increasing discussions around crypto custody regulation adjustments
- Continued interest from institutional investors
- Expansion of Bitcoin ETFs and structured products
- Growing integration of Bitcoin into traditional financial systems
These factors create latent upward pressure, even if short-term technicals remain uncertain.
At the same time, macroeconomic conditions—such as interest rates and liquidity—remain critical variables that could influence Bitcoin’s direction.
7. What This Means for Investors and Builders
For investors seeking new opportunities and income streams, the current market presents both risk and potential.
Short-Term Traders
- Watch the $69,000 breakout level closely
- Prepare for volatility expansion
- Use tight risk management due to binary outcomes
Long-Term Investors
- Monitor deeper support zones for accumulation
- Focus on on-chain valuation metrics rather than short-term noise
Builders and Entrepreneurs
- Periods of consolidation are often the best time to build
- Infrastructure, compliance, and user experience innovations remain key
- Institutional adoption trends suggest long-term growth in blockchain applications
8. Conclusion: The X-Day Is Approaching
Bitcoin stands at a critical juncture.
The $69,000–$70,000 resistance zone is more than just a technical level—it is a dividing line between two fundamentally different market narratives:
- A breakout could ignite the next bullish phase toward $74,000 and beyond
- A rejection could trigger a broader correction, potentially testing deeper structural support levels
With historical patterns, on-chain data, and macro developments all converging, mid-April 2026 is shaping up to be a decisive moment.
Whether the market moves up or down, one thing is clear:
The current period of stagnation will not last much longer.