
Main Points :
- Bitcoin is testing a critical pivot around $71,500, forming a compression zone
- Technical patterns suggest a breakout toward $76,000–$80,000
- On-chain data indicates reduced sell-side volatility and controlled distribution
- Futures markets are driving momentum, while spot demand remains weak
- Macro factors such as geopolitical tensions and the U.S. dollar index (DXY) continue to influence short-term price action
- Sustained breakout requires real demand, accumulation, and absorption of selling pressure
1. Bitcoin Enters a Compression Phase: Calm Before the Storm
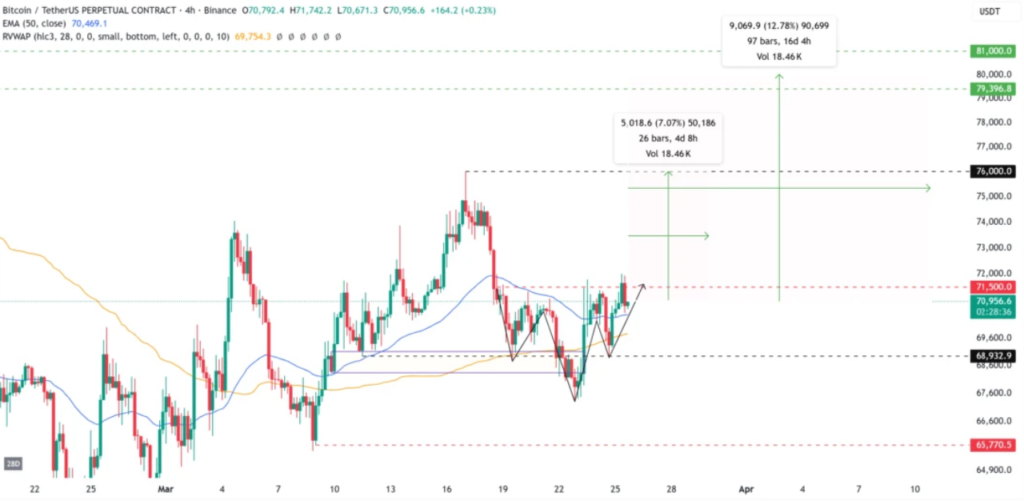
Bitcoin has entered what traders increasingly describe as a “compression zone”—a period where price movement narrows and volatility contracts before a decisive breakout. Around the $71,500 level, Bitcoin has repeatedly tested support and resistance across multiple timeframes, signaling that the market is approaching a critical inflection point.
This compression is not merely a visual chart phenomenon; it reflects a deeper equilibrium between buyers and sellers. When price ranges tighten, liquidity builds up, and once the balance tips, the resulting move is often sharp and directional. Historically, such compression phases in Bitcoin have preceded significant rallies or corrections, depending on the underlying market structure.
At present, Bitcoin is maintaining strength above the 50-period exponential moving average (EMA) on the 4-hour chart, suggesting short-term bullish momentum. However, the 50-day EMA on the daily chart continues to act as resistance, highlighting that the broader trend has not yet fully confirmed a bullish reversal.
This duality—short-term strength versus longer-term resistance—is precisely what defines a compression phase. It is a market waiting for confirmation.
2. Technical Structure Points to a Breakout Toward $80,000
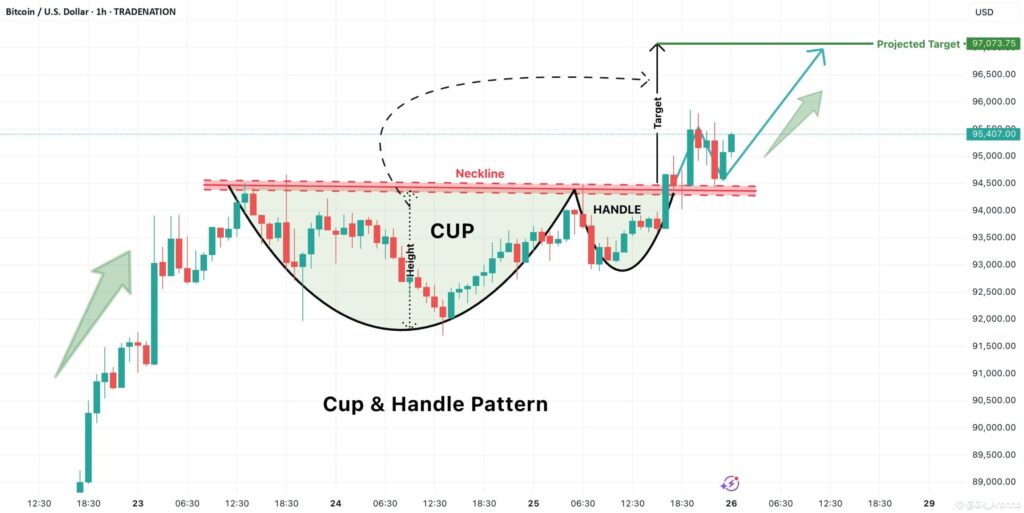
From a technical analysis standpoint, one of the most compelling developments is the formation of an inverse head-and-shoulders pattern on the 4-hour chart. This classic bullish reversal structure has a neckline positioned near $71,500—the very level currently being contested.
If Bitcoin successfully breaks and holds above this neckline, the immediate technical target lies near the recent monthly high of approximately $76,000. However, several analysts extend this projection further, identifying $80,000 as a realistic near-term target.
Why $80,000? The answer lies in both measured move projections and psychological resistance levels. The height of the pattern, when added to the breakout point, aligns closely with this price range. Additionally, round-number milestones often attract liquidity and trader attention, amplifying price momentum.
Importantly, a breakout alone is not sufficient. For the move to sustain, Bitcoin must demonstrate follow-through—continued buying pressure and volume expansion. Without this, the breakout risks becoming a “fakeout,” trapping late buyers.
3. On-Chain Signals Suggest a Controlled Market Ready for Expansion
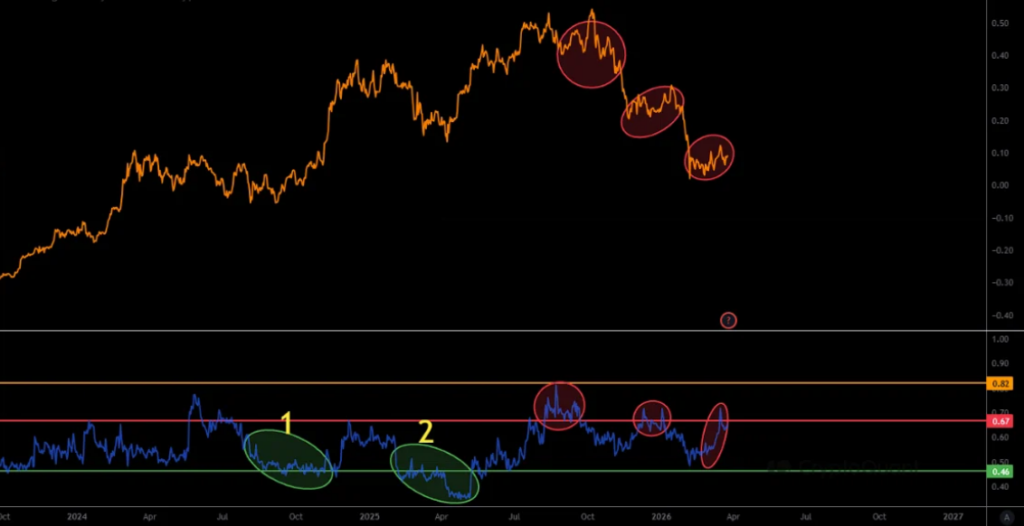
Beyond price charts, on-chain data provides valuable insight into market behavior. One key metric—the 7-day standard deviation of short-term holder realized profit and loss—has recently declined to levels historically associated with pre-rally conditions.
In previous instances, similar readings preceded Bitcoin rallies of approximately 10% to 14%. The current compression in this metric indicates that sell-side volatility has decreased, meaning fewer participants are aggressively taking profits or cutting losses.
This creates a more stable distribution environment, where coins are being held rather than rapidly traded. Such conditions often act as a springboard for upward price movement, as reduced selling pressure allows demand to exert greater influence.
In essence, the market is becoming “quiet”—and in crypto, quiet markets often precede loud moves.
4. A Divided Market: Futures Momentum vs. Weak Spot Demand
Despite bullish technical and on-chain signals, the underlying market structure remains divided. One of the most notable dynamics is the divergence between futures-driven activity and spot market participation.
Bitcoin’s open interest in futures markets has increased significantly, rising by approximately $500 million to reach $16.5 billion. At the same time, funding rates have turned positive, indicating that traders are increasingly taking long positions.
This suggests that recent price gains are largely driven by leveraged speculation rather than organic demand.
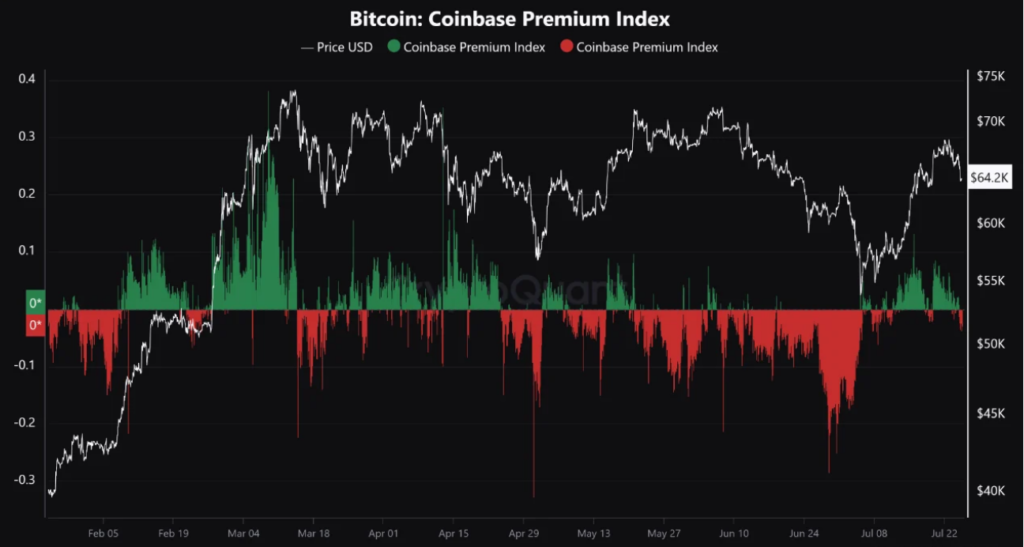
On the other hand, spot market indicators paint a more cautious picture. The cumulative volume delta (CVD) remains negative, and the Coinbase premium—often used as a proxy for U.S. institutional demand—has also turned negative.
This implies that real buying pressure, particularly from large institutional players, has not yet fully materialized.
Such divergence introduces fragility into the market. Futures-driven rallies can be powerful but are often susceptible to rapid reversals if sentiment shifts or leverage unwinds.
5. Macro Forces Continue to Shape Bitcoin’s Trajectory
Bitcoin does not operate in isolation. Recent price resilience has been partially attributed to optimism surrounding geopolitical developments, particularly the possibility of a ceasefire in tensions involving the United States, Israel, and Iran.
However, this optimism remains fragile. Conflicting reports and ongoing negotiations introduce uncertainty, which can quickly translate into market volatility.
Additionally, the strength of the U.S. dollar index (DXY) continues to exert pressure on risk assets, including Bitcoin. A stronger dollar typically reduces liquidity in global markets, making it more challenging for speculative assets to sustain rallies.
Energy prices also play a role, as they influence inflation expectations and central bank policy—both of which have downstream effects on crypto markets.
For investors and traders, this underscores the importance of monitoring macro signals alongside technical and on-chain indicators.
6. The Key to a Sustained Rally: Real Demand and Absorption of Selling Pressure
Ultimately, the path to $80,000 hinges on one critical factor: real demand.
While a $60 million buy order executed during the New York session signals renewed interest, isolated events are not enough. For Bitcoin to sustain a breakout above $71,500, the market must exhibit consistent characteristics:
- Strong spot buying from institutional and retail participants
- Continuous accumulation rather than short-term speculation
- Effective absorption of sell-side pressure, particularly from short traders
Without these elements, any upward move risks losing momentum.
The market is currently at a crossroads. The technical setup is bullish, on-chain data is supportive, but structural weaknesses remain. Whether Bitcoin reaches $80,000 in the near term will depend on whether real demand steps in to validate the breakout.
Conclusion: A Market on the Edge of Expansion
Bitcoin’s current compression phase represents a pivotal moment. The convergence of technical patterns, on-chain signals, and macro conditions suggests that a significant move is imminent.
The probability of an upward breakout toward $80,000 is increasing, but it is not guaranteed. The market must transition from speculation-driven momentum to demand-driven growth.
For investors seeking new opportunities, this environment offers both risk and reward. A confirmed breakout could open the door to the next phase of the bull cycle, while a failed attempt may present alternative entry points.
In the broader context of blockchain adoption and digital asset innovation, Bitcoin’s behavior at this juncture serves as a barometer for the entire crypto ecosystem.
The compression is tightening. The question is no longer whether a move will occur—but in which direction, and with what conviction.


