Main Points :
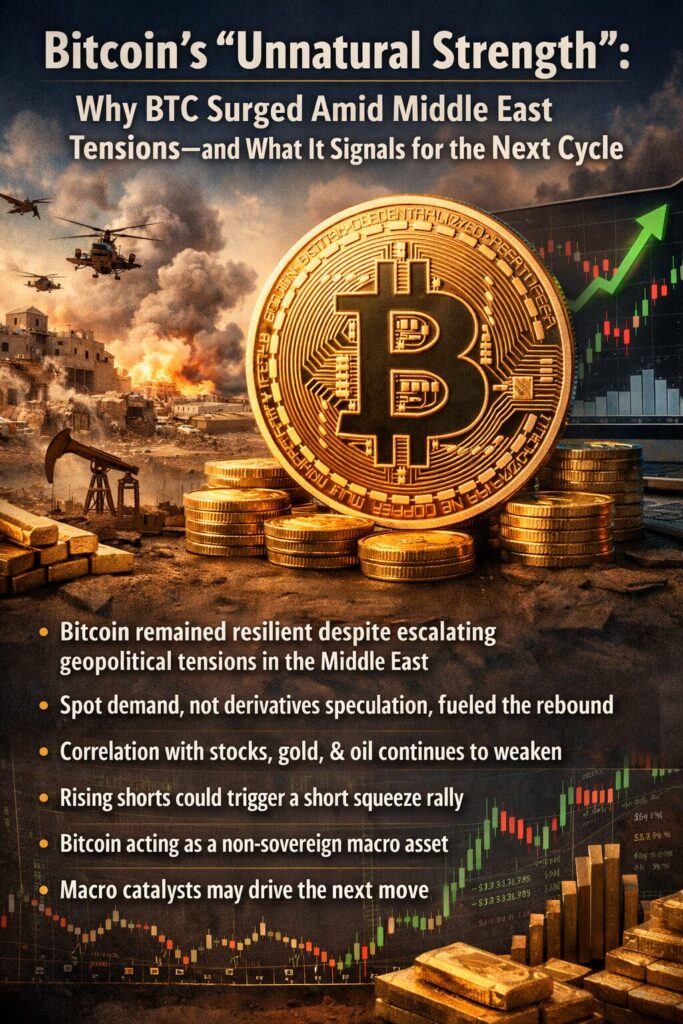
- Bitcoin remained resilient despite escalating geopolitical tensions in the Middle East
- The rebound was driven by spot demand, not derivatives speculation
- Correlation with traditional assets (stocks, gold, oil) continues to weaken
- Rising short positions could trigger a short squeeze-driven rally
- Bitcoin is increasingly behaving as a non-sovereign macro asset
- Macro catalysts (PMI, options expiry) may drive the next move
1. Bitcoin’s Resilience in a Geopolitical Shock
On March 23, 2026, global markets faced a sudden surge in geopolitical risk. Reports of U.S. military strikes on Iranian infrastructure and threats of a blockade of the Strait of Hormuz sent shockwaves through traditional markets. Equities and precious metals both declined sharply, reflecting heightened uncertainty and capital flight.
Yet Bitcoin behaved differently.
Instead of collapsing alongside risk assets, BTC recorded only a modest decline. This divergence immediately drew attention across the crypto and macro investment community. Historically, Bitcoin has often been categorized as a high-risk asset, moving in tandem with equities during stress events. However, this episode revealed a shift in market behavior.
Bitcoin’s ability to maintain relative stability during a geopolitical shock suggests that market participants are increasingly viewing it as a neutral, borderless asset, rather than a speculative tech proxy.
2. The Catalyst: Oil Collapse and Sudden Reversal
Later that evening, the narrative shifted dramatically. Reports emerged of a temporary ceasefire agreement, facilitated via Pakistan, and a five-day halt to airstrikes involving Israel. As tensions eased, oil prices dropped sharply.
Bitcoin responded immediately.
Within hours, BTC surged, recording a price increase equivalent to approximately $4,000–$5,000 (converted to USD). This rapid rebound was not merely a technical bounce—it reflected a structural shift in how Bitcoin reacts to macro inputs.
Unlike traditional safe havens such as gold, Bitcoin did not simply track fear or relief. Instead, it appeared to respond directly to liquidity expectations and energy market signals, suggesting a more complex macro sensitivity.
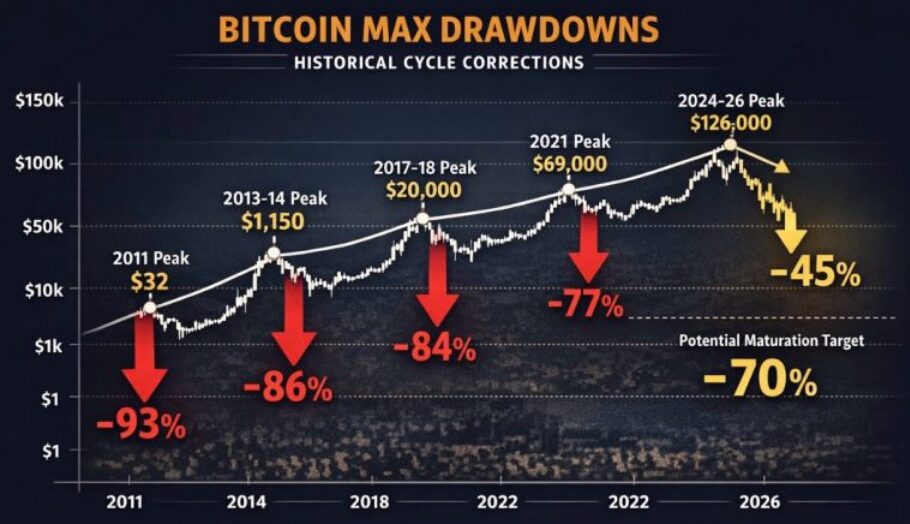
3. Insert Chart Here: Bitcoin Cycle Trend
This chart illustrates a simplified representation of Bitcoin’s cyclical behavior, highlighting peaks and corrections across multiple years.
3. Spot Demand Dominates: A Structural Bullish Signal
One of the most important insights from this market move is the nature of the buying pressure.
Order flow data shows that the rally was driven primarily by spot market buying, not leveraged futures. This distinction is critical.
- Spot-driven rallies indicate real capital inflow
- Futures-driven rallies often reflect short-term speculation
In this case, the dominance of spot buying suggests that institutional and long-term investors are accumulating Bitcoin at current levels.
This aligns with broader trends observed in recent months, including:
- Increased ETF inflows (despite short-term volatility)
- Growing institutional custody solutions
- Expansion of Bitcoin treasury strategies among corporations
Together, these factors point to a structural shift in demand, rather than a temporary speculative surge.
4. Derivatives Market: Short Positions Are Building
While spot demand supported the rally, derivatives data tells another story.
Following the price surge, open interest increased, and so did the proportion of short positions. This suggests that many traders are betting against the current price level, possibly viewing the rally as overextended.
However, this creates a paradox.
If Bitcoin maintains or slightly increases its current price range, these short positions could be forced to close—triggering a short squeeze. Such events often lead to rapid, cascading price increases.
In other words, bearish positioning may ironically become fuel for the next upward move.
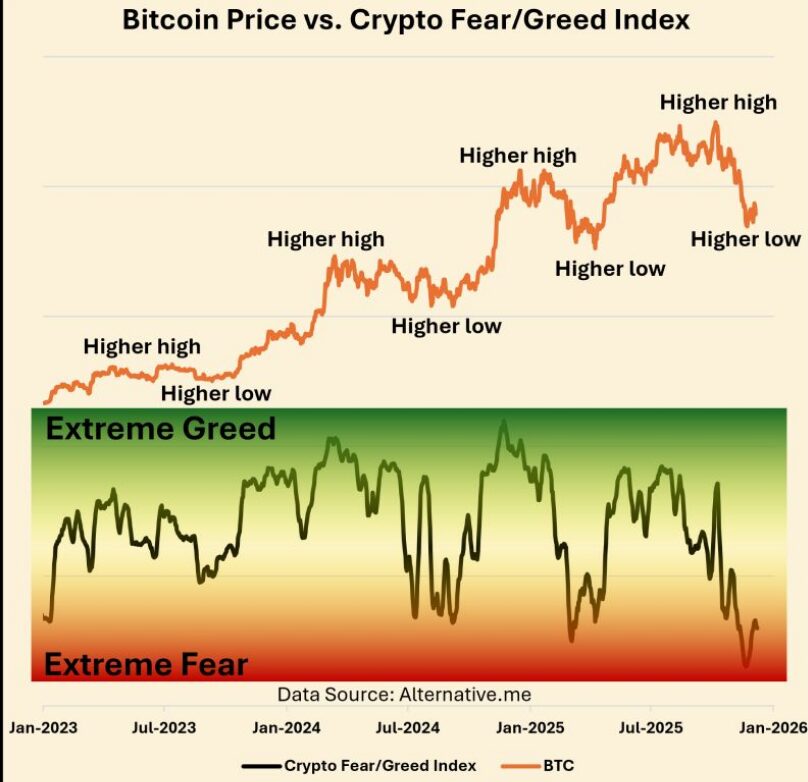
5. Insert Chart Here: Sentiment vs Price
This chart demonstrates the inverse relationship between market sentiment and price turning points.
5. Decoupling from Traditional Assets
Perhaps the most significant takeaway is Bitcoin’s declining correlation with traditional markets.
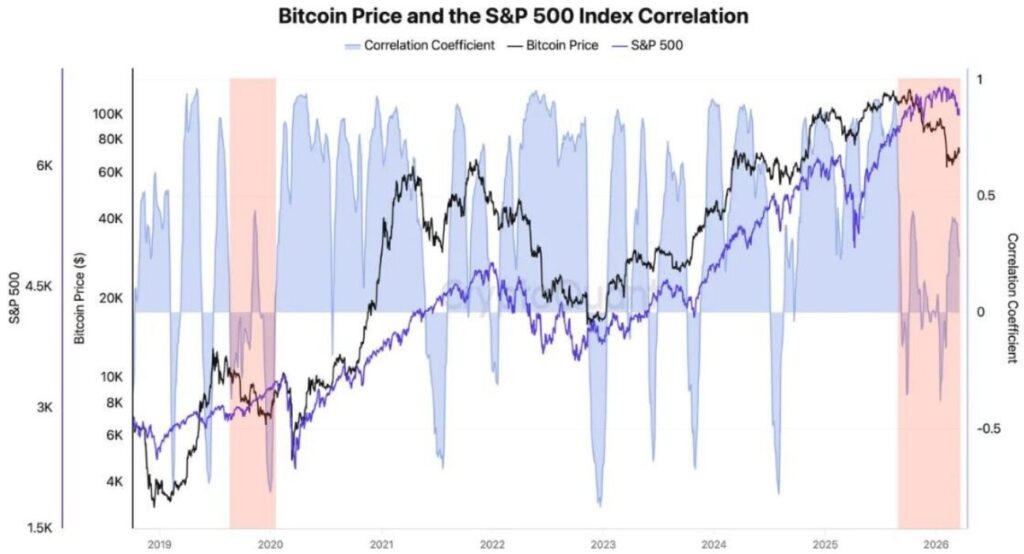
Recent data shows:
- S&P 500 correlation: -0.09
- Nasdaq 100: +0.12
- Gold: -0.25
- Oil: -0.24
These near-zero correlations indicate that Bitcoin is no longer tightly linked to either risk assets or safe havens.
6. Insert Chart Here: BTC vs S&P 500 Correlation
This conceptual chart shows how Bitcoin’s price movements may align with broader equity market trends.
This decoupling is critical for investors.
It suggests that Bitcoin is evolving into a distinct asset class, driven by its own supply-demand dynamics, rather than external macro correlations.
This transformation mirrors earlier stages in the development of gold as a macro asset, but with a digital-native structure.
6. Bitcoin as a “Non-Sovereign Asset”
The events of March 23–24 reinforce a growing narrative: Bitcoin is increasingly functioning as a non-sovereign asset.
Unlike fiat currencies, which are tied to national economies, or commodities, which are influenced by physical supply chains, Bitcoin operates independently of geopolitical boundaries.
This characteristic becomes particularly valuable during periods of global uncertainty.
Investors seeking diversification are beginning to recognize Bitcoin’s role as:
- A hedge against monetary policy instability
- A neutral asset in geopolitical conflicts
- A digital alternative to store-of-value assets
7. Macro Outlook: Key Dates to Watch
Looking ahead, several macro events could influence Bitcoin’s trajectory:
- March 24: U.S. PMI (Purchasing Managers’ Index)
- March 27: Bitcoin options major expiry (SQ)
- April 1: U.S. retail sales data
These events will provide insight into economic momentum, liquidity conditions, and investor sentiment.
Given Bitcoin’s evolving macro sensitivity, these indicators may play a larger role in price formation than in previous cycles.
8. Strategic Implications for Investors
For readers seeking new crypto assets, revenue opportunities, and practical blockchain applications, this market environment offers several key insights:
- Accumulation Phase May Be Underway
Spot-driven buying suggests long-term capital positioning. - Volatility Creates Opportunity
Short squeeze potential implies asymmetric upside risk. - Diversification Value Is Increasing
Bitcoin’s low correlation enhances portfolio resilience. - Macro Awareness Is Essential
Bitcoin is no longer isolated from global economic narratives.
Conclusion
Bitcoin’s recent price action represents more than a short-term rebound—it marks a structural evolution in how the asset is perceived and traded.
Its resilience during geopolitical turmoil, combined with spot-driven demand and weakening correlations with traditional markets, underscores a critical transition: Bitcoin is maturing into a global macro asset with independent dynamics.
For investors, this shift opens new possibilities.
Bitcoin is no longer just a speculative instrument—it is becoming a foundational component of modern portfolios, offering both growth potential and strategic diversification.
As the next cycle unfolds, understanding these dynamics will be essential for identifying opportunities and managing risk in the evolving digital asset landscape.


