Main Points :
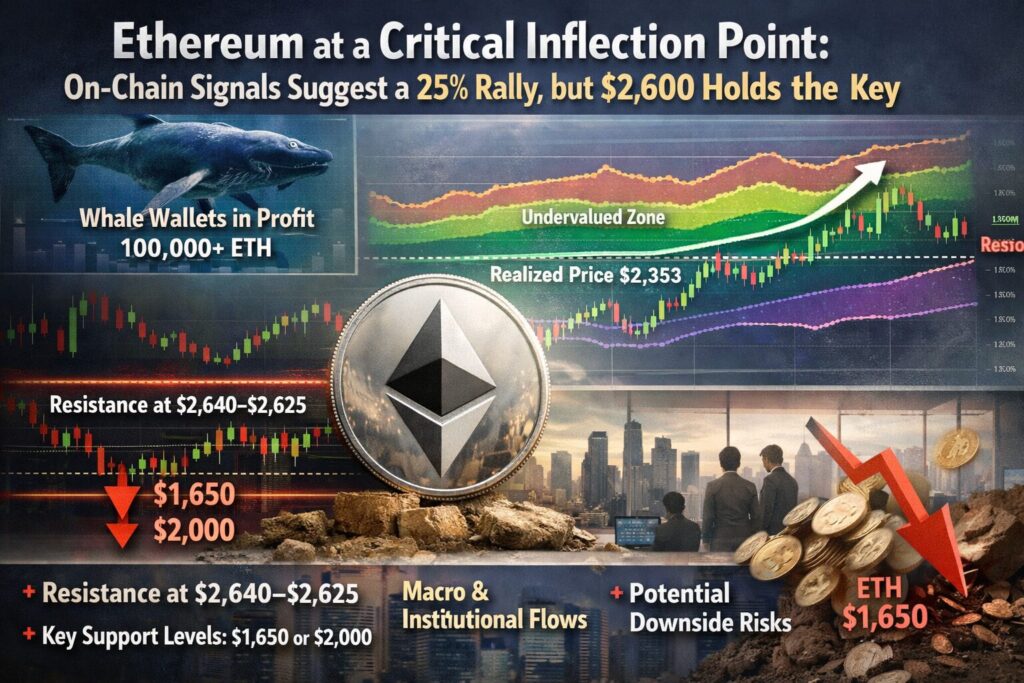
- Whale wallets holding 100,000+ ETH have returned to unrealized profit, historically a bullish trigger
- On-chain indicators (MVRV bands) suggest ETH is emerging from undervaluation
- The realized price at ~$2,353 is a key recovery threshold
- Resistance near ~$2,640–$2,625 aligns across technical and on-chain metrics
- Failure scenarios still point to downside risks toward $1,650 or $2,000
- Macro and institutional flows continue to shape ETH’s medium-term outlook
1. Whale Profitability Returns: A Structural Shift in Market Psychology
Ethereum (ETH) has entered a potentially decisive phase, as on-chain data reveals that large holders—commonly referred to as “whales”—have returned to a state of unrealized profit for the first time since early February. Specifically, wallets holding more than 100,000 ETH have transitioned from net losses into profitability, marking a historically significant inflection point.
This shift is not merely statistical noise; it reflects a deeper structural change in market psychology. When whales are underwater, they tend to either hold defensively or reduce exposure under stress. However, once profitability returns, their incentives change dramatically. Selling pressure diminishes, and confidence in holding—or even accumulating—assets increases.
Historically, similar transitions have marked the beginning of sustained upward trends. According to aggregated on-chain analyses:
- ETH has risen approximately 25% within three months
- Around 50% within six months
- Up to 300% within one year
These patterns suggest that the return of whale profitability often precedes broader market recovery and expansion.
[Whale Unrealized Profit Ratio Chart]
2. Why Whale Behavior Matters More Than Retail Sentiment
In modern crypto markets, whales play a role analogous to institutional investors in traditional finance. Their behavior influences liquidity, volatility, and directional trends.
Unlike retail participants, whales:
- Operate with longer time horizons
- Have access to superior liquidity strategies
- Often accumulate during periods of pessimism
The transition into profit territory implies that accumulation phases may already be complete, and the market is entering a markup phase.
This aligns with a broader structural narrative: crypto markets are increasingly driven by capital rotation rather than retail speculation alone. In Ethereum’s case, whale profitability could signal:
- Reduced downside volatility
- Strengthening support zones
- Gradual expansion of bullish momentum
However, it is critical to note that this signal is not infallible. In 2018, a similar transition resulted in a temporary rally before a severe downturn of nearly 70%. Therefore, context—especially macro conditions—remains essential.
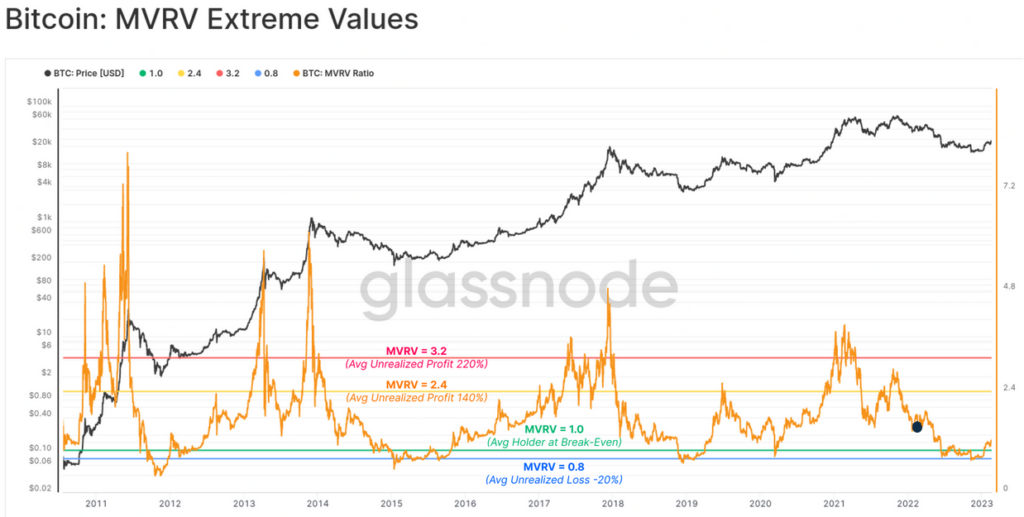
3. MVRV Bands and Undervaluation Recovery: A Technical Foundation
Another key indicator reinforcing the bullish thesis is Ethereum’s position within MVRV (Market Value to Realized Value) deviation bands.
Currently, ETH is rebounding from the lowest deviation zone, historically associated with undervaluation. Similar conditions were observed:
- In Q2 2022, after which ETH staged a recovery
- In Q2 2025, marking another accumulation-driven rebound
At present:
- Realized Price: ~$2,353
- Next Key Resistance (−0.5σ Band): ~$2,640
The realized price represents the average acquisition cost of all ETH holders. When price trades below this level, the majority of holders are at a loss—creating pessimism and suppressed market activity.
A breakout above this level signals:
- Return to aggregate profitability
- Improved market sentiment
- Increased likelihood of capital inflows
[MVRV Pricing Bands Chart]
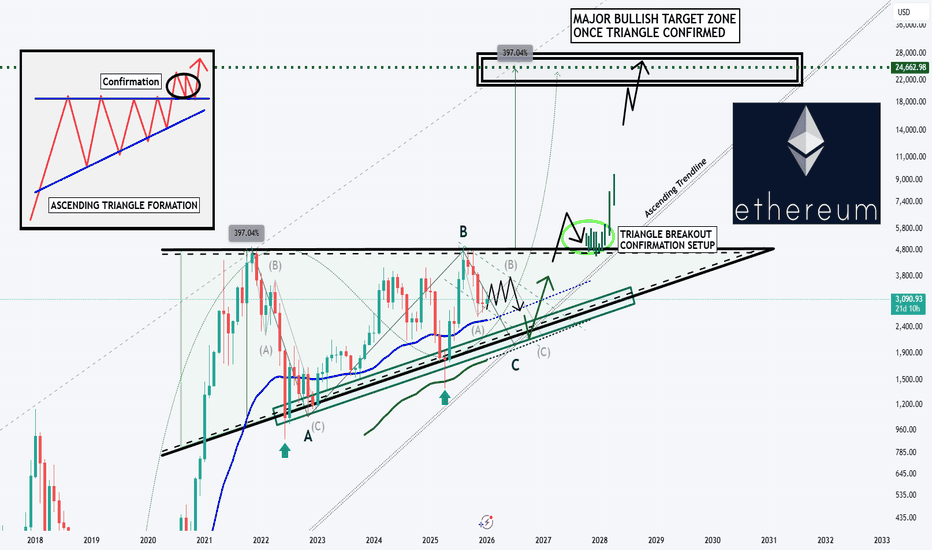
4. The $2,600 Zone: Confluence of On-Chain and Technical Resistance
The importance of the $2,600 range cannot be overstated. It represents a convergence of multiple analytical frameworks:
- On-chain resistance (MVRV band): ~$2,640
- Technical breakout target: ~$2,625
- Psychological round number: ~$2,600
This type of confluence significantly increases the probability that the level will act as a decisive pivot point.
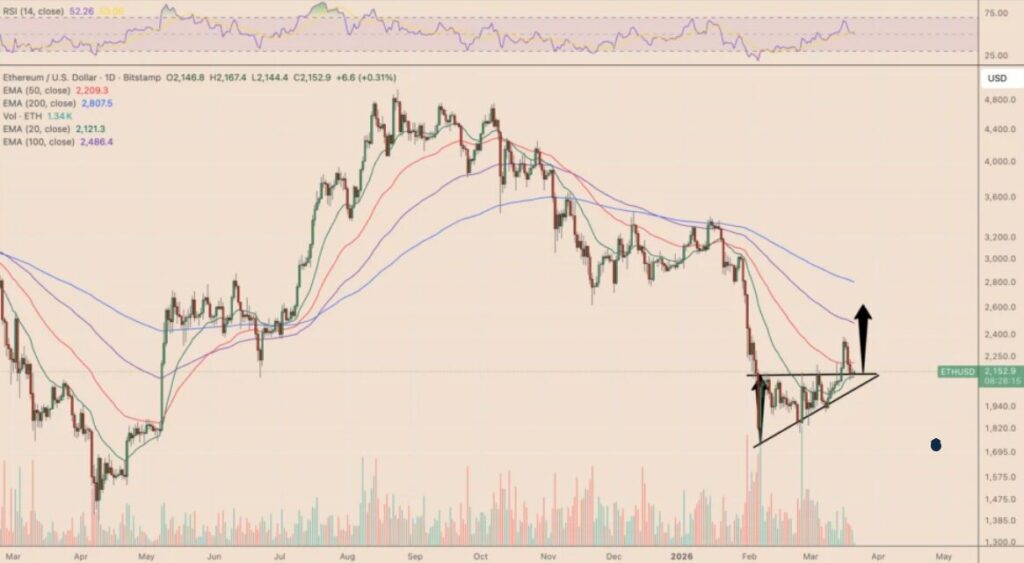
From a technical perspective, Ethereum recently broke out of an ascending triangle pattern, a classic bullish continuation formation. After the breakout, price retraced to retest the former resistance line—a common and healthy market behavior.
If this retest holds:
- The previous resistance becomes support
- A continuation toward $2,600+ becomes likely
If it fails:
- The breakout is invalidated
- Downside risk increases
[ETH Ascending Triangle Chart]
5. Downside Risks: Why This Is Not a One-Way Bet
Despite the optimistic signals, Ethereum faces several downside scenarios:
Failure to reclaim $2,353 (realized price)
- Indicates persistent market weakness
- Suggests continued unrealized losses across holders
Breakdown of technical structure
- Could lead to retest of $1,950–$2,000 support zone
Extreme bearish scenario
- Return to $1,650, aligning with lower MVRV deviation band
Additionally, macroeconomic factors—such as interest rates, regulatory developments, and ETF flows—can override on-chain signals in the short term.
6. Broader Market Context: Ethereum in 2026
Beyond technical and on-chain data, Ethereum’s outlook is shaped by several structural trends:
1. Institutional Adoption
Ethereum continues to benefit from institutional interest, particularly in:
- Tokenization of real-world assets (RWA)
- Stablecoin infrastructure
- Layer-2 scaling ecosystems
2. Layer-2 Expansion
The growth of rollups (e.g., Arbitrum, Optimism) is:
- Increasing transaction throughput
- Reducing fees
- Enhancing Ethereum’s long-term utility
3. Capital Rotation
Bitcoin dominance cycles often precede Ethereum rallies. As capital rotates from BTC to ETH:
- ETH tends to outperform in mid-cycle phases
- Altcoin ecosystems expand
7. Strategic Implications for Investors and Builders
For investors seeking new income opportunities or alpha generation, the current setup presents both risk and opportunity.
Bullish Strategy
- Monitor breakout above $2,600
- Accumulate on successful retest of support
Defensive Strategy
- Watch $2,353 level closely
- Reduce exposure if breakdown occurs
Builder Perspective
For blockchain entrepreneurs and developers:
- ETH recovery phases often coincide with increased:
- Funding
- User activity
- Ecosystem growth
This is particularly relevant for projects focused on:
- DeFi infrastructure
- Payment systems
- Tokenized assets
Conclusion: A High-Conviction Setup with Critical Dependencies
Ethereum is approaching a critical inflection point defined by the intersection of whale behavior, on-chain valuation, and technical structure.
The return of whale profitability provides a strong historical signal for upward movement. Meanwhile, MVRV-based analysis suggests ETH is emerging from undervaluation, reinforcing the bullish case.
However, the $2,600 range stands as the ultimate test. A confirmed breakout could trigger a 25% rally toward $2,750 and beyond, potentially extending toward $3,200 in the following months.
Conversely, failure to sustain key levels could reintroduce downside risks, reminding investors that even strong signals are not guarantees.
In this environment, disciplined positioning—guided by both on-chain intelligence and macro awareness—remains essential.


