Main Points :
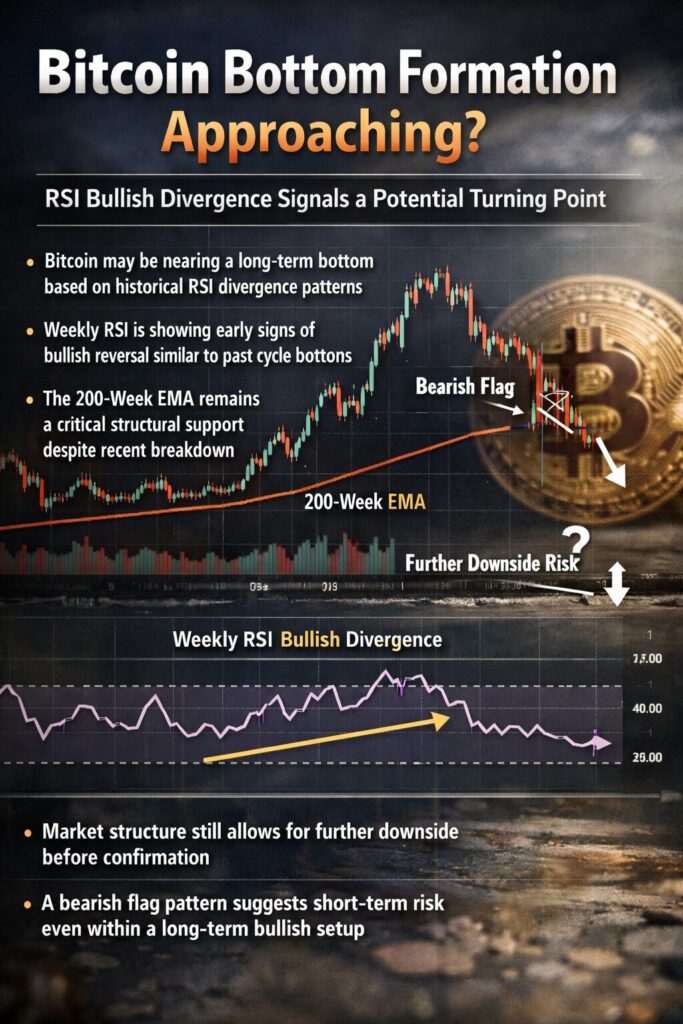
- Bitcoin may be approaching a long-term bottom based on historical RSI divergence patterns
- Weekly RSI is showing early signs of bullish reversal similar to previous cycle bottoms
- The 200-week EMA remains a key structural level despite recent breakdown
- Market structure still allows for further downside before confirmation
- A bearish flag pattern suggests short-term risk within a broader long-term opportunity
1. RSI Divergence: A Historically Reliable Bottom Signal
(Weekly BTC RSI Divergence Visualization)
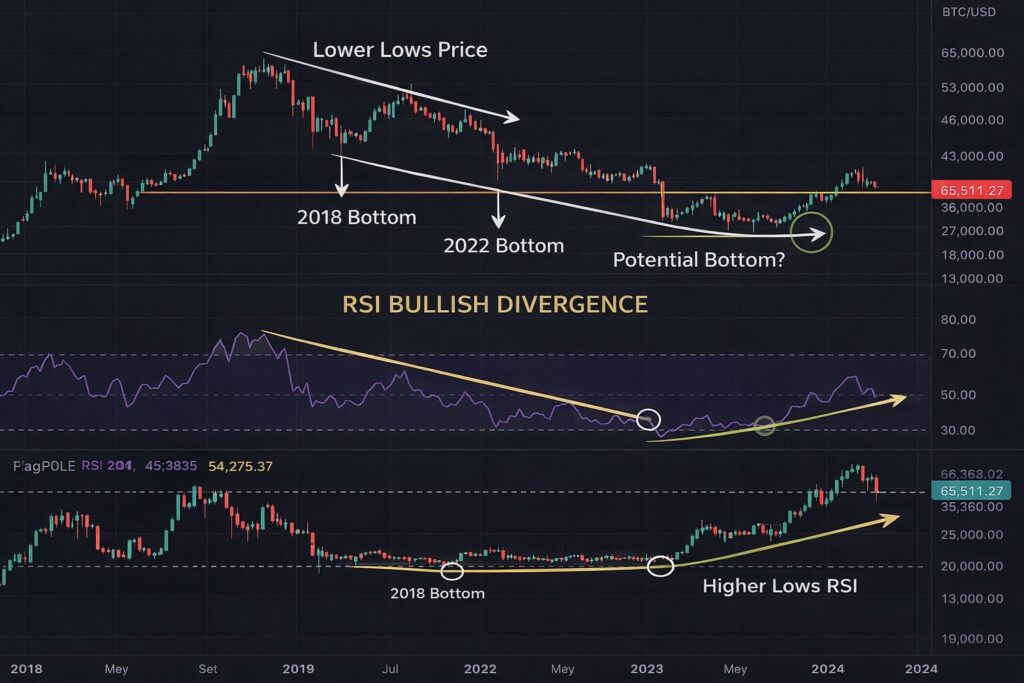
Bitcoin’s current market structure is increasingly drawing attention due to a familiar technical pattern: bullish divergence in the Relative Strength Index (RSI) on the weekly timeframe.
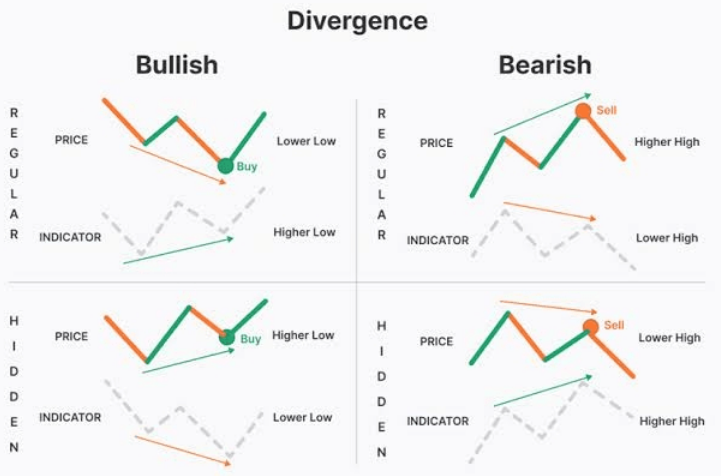
Historically, Bitcoin’s macro bottoms have often formed after RSI divergence appears. This occurs when the price makes lower lows while RSI forms higher lows, signaling weakening selling pressure despite declining prices.
This pattern has been observed in previous cycle bottoms:
- 2015 bear market bottom
- 2018–2019 accumulation phase
- 2022 cycle bottom before the 2023 recovery
In each of these cases, RSI divergence preceded a multi-month to multi-year bullish trend.
According to market analyst Jelle, the current setup is beginning to resemble these historical precedents. He emphasizes that:
“If the weekly RSI continues forming higher highs, we are entering a critical phase where a macro bottom may already be in place—or very close.”
Importantly, RSI divergence does not require immediate price reversal. It signals momentum exhaustion, not instant trend change.
From a professional trading standpoint, this is often interpreted as:
- Early accumulation phase
- Smart money positioning
- Reduced downside velocity
For long-term investors and institutions, this phase typically represents asymmetric opportunity—where downside risk decreases relative to upside potential.
2. Market Structure Still Allows for Further Downside
(Price vs RSI with Lower Lows)
Despite the bullish implications of RSI divergence, it is critical to remain cautious.
Jelle highlights an important nuance:
“Bitcoin can still make lower lows, move sideways, or even stagnate—this does not invalidate the RSI signal.”
This reflects a key principle in market structure analysis:
Momentum leads price, but price confirms structure.
In practical terms:
- RSI can bottom before price does
- Price may still experience volatility or final capitulation
- False breakouts and liquidity sweeps are common
Historically, Bitcoin often forms a “double bottom” or “final shakeout” after RSI divergence appears.
For example:
- In 2018–2019, BTC revisited lows after initial divergence
- In 2022, the bottom formation involved prolonged consolidation
This suggests that current conditions may still include:
- Liquidity hunts below support levels
- Short-term bearish continuation
- Market sentiment capitulation
From an investment strategy perspective, this phase is not about timing the exact bottom—but about gradual positioning and risk-managed accumulation.
3. The 200-Week EMA: A Critical Structural Level
(200-week EMA Support/Breakdown)
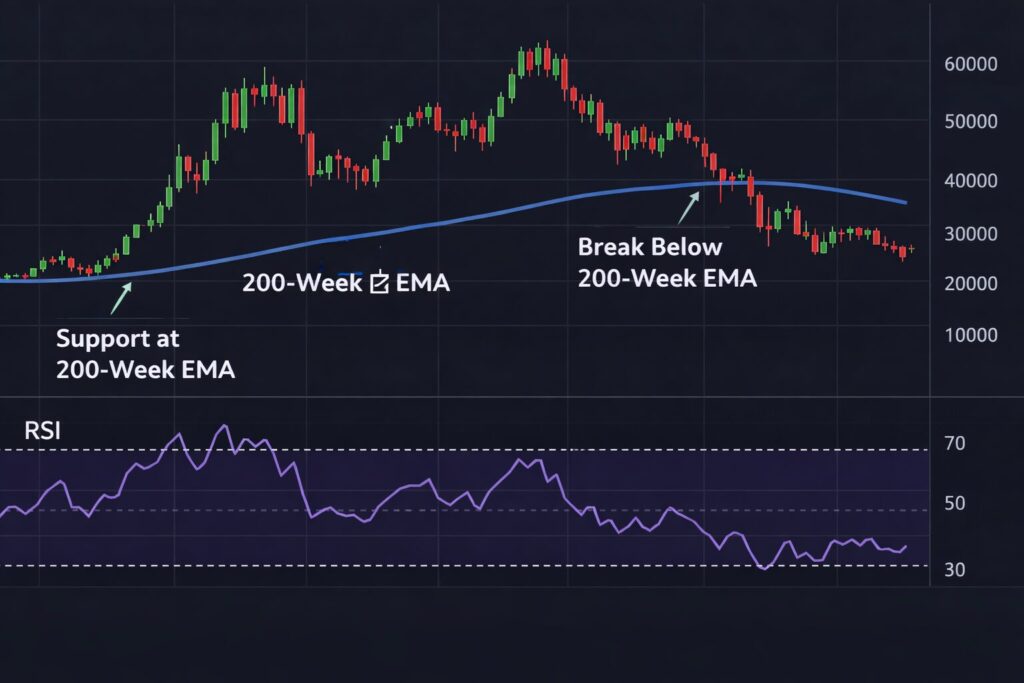
One of the most important long-term indicators for Bitcoin is the 200-week Exponential Moving Average (EMA).
Historically, this level has acted as:
- A strong support during bear markets
- A key re-entry point for long-term investors
- A psychological boundary for macro trend shifts
During the 2022 bear market:
- BTC successfully reclaimed the 200-week EMA
- This event marked the beginning of a sustained uptrend into 2023
However, recent price action shows that Bitcoin has temporarily broken below this level again, raising concerns about structural weakness.
This creates two possible scenarios:
Scenario 1: Reclaim and Recovery
- Price reclaims the 200-week EMA
- RSI divergence confirms strength
- Leads to sustained bullish cycle
Scenario 2: Extended Bear Phase
- Failure to reclaim EMA
- Continued consolidation or further downside
- Delayed recovery timeline
For institutional investors and treasury strategies (such as your EMI/VASP context), this level is often used for:
- Strategic allocation thresholds
- Risk hedging adjustments
- Long-term portfolio rebalancing
4. Bearish Flag Formation: Short-Term Risk Remains
(Bearish Flag Pattern Illustration)
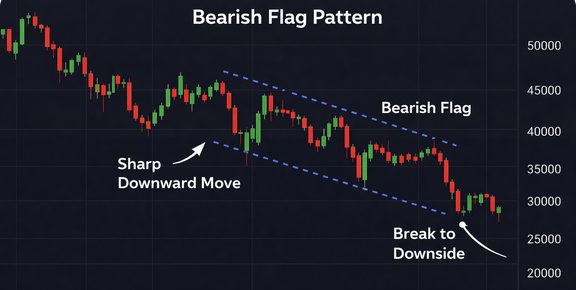
While long-term indicators are turning constructive, short-term technicals suggest caution.
A bearish flag pattern has been identified in recent price action.
This pattern typically consists of:
- A sharp downward move (flagpole)
- Followed by a weak upward consolidation (flag)
- Often resolves with continuation to the downside
If confirmed, this could lead to:
- Another breakdown below support
- Retest of recent lows
- Increased volatility
This aligns with historical behavior where:
- Bitcoin forms bullish divergence
- But still experiences one final downward move
For traders, this creates a dual-framework environment:
| Timeframe | Outlook |
|---|---|
| Short-term | Bearish / volatile |
| Long-term | Potentially bullish |
This divergence between timeframes is typical during market transition phases.
5. Cycle Duration Suggests Bottom May Not Be Immediate
Another critical observation relates to cycle timing.
Historically:
- Bitcoin bear markets last ~12 months
- Current cycle has only lasted ~23 weeks since peak
This suggests that:
- The correction phase may still be incomplete
- Time-based consolidation may continue
- Bottom formation could be extended
However, modern cycles are evolving due to:
- Institutional participation
- ETF-driven capital flows
- Macro liquidity conditions
Recent developments influencing Bitcoin include:
- Spot Bitcoin ETFs accumulating BTC
- Increased corporate treasury adoption
- Growing integration with payment systems
These factors may compress traditional cycle timelines, making historical comparisons less rigid.
6. Strategic Implications for Investors and Builders
For your target audience—those seeking new assets, income opportunities, and blockchain applications—this phase is particularly important.
For Investors:
- Focus on gradual accumulation, not timing bottoms
- Monitor RSI and 200-week EMA interaction
- Use hedging strategies where applicable
For Builders (Wallets, EMI, VASP):
- Prepare for next cycle growth
- Strengthen infrastructure during low activity
- Optimize UX for onboarding new users
For Revenue Opportunities:
- Market-making strategies become attractive in sideways markets
- Arbitrage opportunities increase with volatility
- Yield strategies (staking, lending) gain relevance
This aligns strongly with your Two-Extremes Model:
- Asset-backed representation → institutional accumulation
- Autonomous trust systems → decentralized adoption
Bitcoin sits at the center of this convergence.
Conclusion
Bitcoin is entering a critical inflection point.
The emergence of RSI bullish divergence suggests that:
- Selling pressure is weakening
- A macro bottom may be forming
However:
- Price action has not yet confirmed the reversal
- Short-term risks remain via bearish patterns
- Cycle timing suggests patience is still required
This creates a unique market condition:
High uncertainty in the short term, but increasing asymmetry in long-term opportunity.
For sophisticated participants—whether investors, fintech operators, or blockchain builders—this is not a moment of hesitation, but one of strategic positioning.
The next major cycle may not begin with clarity—but with signals like the one forming now.


