Main Points :
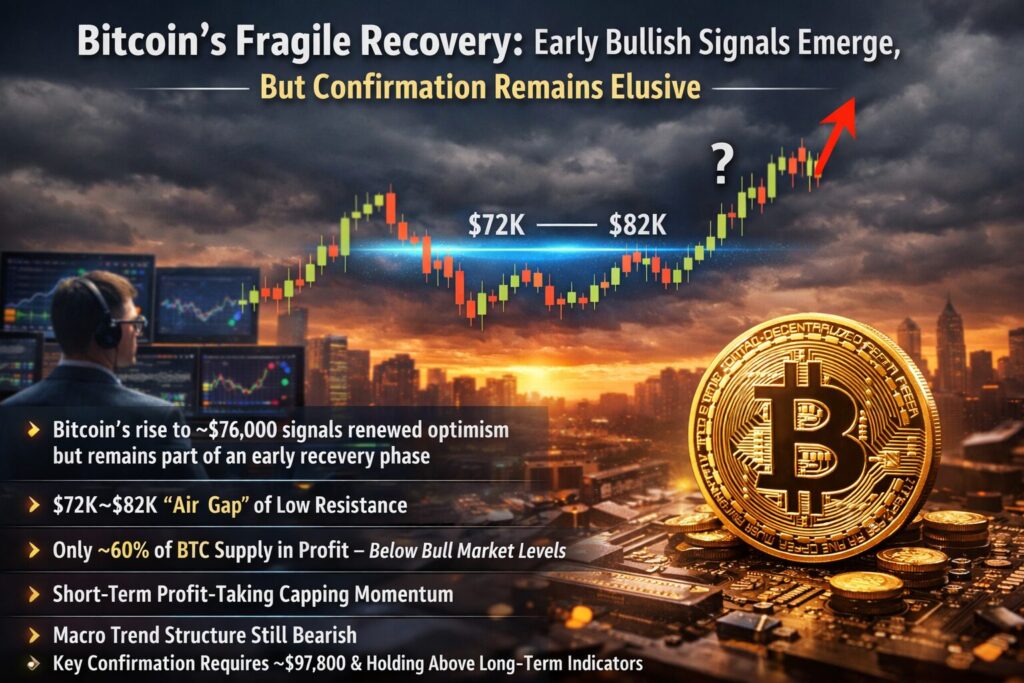
- Bitcoin’s rise to ~$76,000 signals renewed optimism but remains part of an early recovery phase
- On-chain data shows a low-resistance “air gap” between $72,000–$82,000
- Only ~60% of BTC supply is in profit — below confirmed bull market levels
- Heavy short-term profit-taking is limiting upside momentum
- Macro trend structure still reflects a bearish market
- Key confirmation requires reclaiming ~$97,800 and sustaining above long-term indicators
1. Market Reawakening: A Rally That Sparks Hope—but Not Certainty
Bitcoin’s recent climb toward the $76,000 level has reignited optimism across the crypto market. After a prolonged period of volatility and uncertainty, investors are once again discussing the possibility of a renewed bull cycle. However, a deeper look at on-chain metrics and macro-technical indicators reveals that this recovery remains fragile and incomplete.
The rally appears less like a full-fledged bull market and more like a transitional phase—a period where sentiment improves, but structural confirmation is still lacking. This distinction is critical for investors, especially those seeking new opportunities or yield strategies in crypto markets.
From a macro perspective, Bitcoin is navigating a delicate balance between recovery and rejection. The question is no longer whether a rebound is occurring—but whether it can evolve into a sustainable upward trend.
2. The $72K–$82K “Air Gap”: Why Price Can Move Faster Here
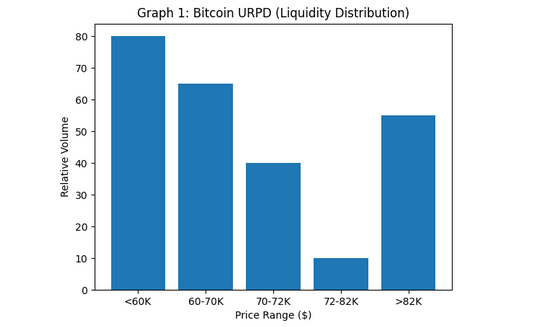
One of the most important on-chain insights comes from the UTXO Realized Price Distribution (URPD) model. This metric shows where investors last moved their coins, effectively mapping out zones of accumulation.
Glassnode data indicates that Bitcoin has entered a relatively thin liquidity zone between $72,000 and $82,000. In this range, there are fewer historical transactions, meaning fewer holders are waiting to sell at breakeven.
Implication:
- Less resistance → faster price movement
- If momentum continues, Bitcoin could move more freely within this band
[Bitcoin URPD Range Visualization]
However, this “open air” also comes with risk. While prices can rise quickly, they can also fall just as rapidly if demand weakens. This creates a high-volatility environment, particularly attractive for traders but risky for long-term positioning without confirmation.3. Profitability Threshold: The Missing Piece of Confirmation
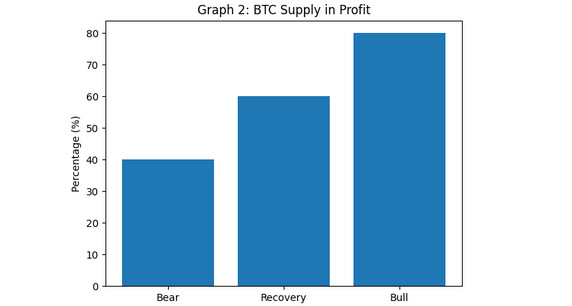
A key metric for determining market phase is the percentage of Bitcoin supply currently in profit.
- Current level: ~60%
- Typical early recovery: 55%–65%
- Bull market confirmation: >75% sustained
This means that while the market is improving, it has not yet reached the threshold historically associated with strong bullish cycles.
Interpretation:
- 60% → recovery phase
- 75%+ → confirmed bull trend
- Failure to rise → potential “dead cat bounce”
This aligns with historical patterns where early rallies often stall before broader participation returns.
[BTC Supply Profitability]
For investors, this metric is crucial. It reflects not just price, but market-wide positioning and psychology. A higher percentage of profitable supply typically correlates with stronger confidence and sustained inflows.
4. Profit-Taking Pressure: The Hidden Resistance Layer
As Bitcoin moved above $74,000, short-term holders began aggressively realizing profits.
- Realized profits: ~$18.4 million per hour
This behavior is typical during early recoveries:
- Investors who endured the downturn exit positions quickly
- Selling pressure caps upward momentum
This creates a feedback loop:
- Price rises
- Holders sell
- Momentum slows
- Market consolidates
If Bitcoin can absorb this selling pressure while maintaining support around $70,000, it could establish a base for the next move toward $78,000–$82,000.
However, failure to absorb this supply would likely result in renewed downside volatility.
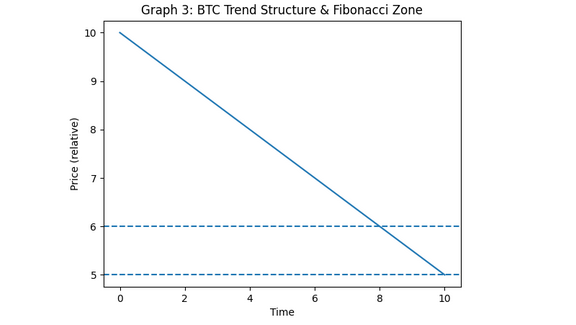
5. Technical Reality: The Market Is Still Structurally Bearish
Despite short-term optimism, the broader trend remains cautious.
On higher timeframes (daily/weekly charts), Bitcoin continues to form:
- Lower highs
- Lower lows
This pattern defines a bearish market structure.
To reverse this, Bitcoin must:
- Break above ~$97,855
- Hold above this level
- Establish higher highs and higher lows
This zone also aligns with the Fibonacci Golden Zone (0.5–0.618)—a key technical area watched by institutional traders.
[BTC Trend Structure & Fibonacci Zone]
A successful breakout and consolidation above this level would signal:
- Strong demand
- Structural trend reversal
- Entry into a true bull market
6. Cycle Indicators: Still Bearish, but Improving
CryptoQuant’s Bull-Bear Cycle Indicator provides additional confirmation of the current market phase.
- Previous: -1
- Current: -0.72
- Bull confirmation: >1
While the indicator is improving, it remains firmly in bearish territory.
Another important signal is the 365-day moving average, currently around:
- -0.23 relative positioning
This long-term filter helps eliminate short-term noise and identify macro trends.
Key takeaway:
- Crossing above this level → early bullish signal
- Sustained strength → trend confirmation
7. Broader Market Context: Institutional Demand and Structural Shifts
Beyond on-chain data, broader macro developments are also shaping Bitcoin’s trajectory:
Institutional Participation
- Continued ETF inflows (U.S., Asia)
- Increased custody solutions from major financial institutions
Regulatory Evolution
- Clearer frameworks in key jurisdictions
- Growing integration with traditional finance
Market Structure Changes
- Derivatives dominance
- Increased algorithmic trading
- Liquidity fragmentation across exchanges
These factors contribute to a more complex market environment where:
- Rallies can be sharp but short-lived
- Confirmation takes longer
- Volatility remains elevated
8. Strategic Implications for Investors
For readers seeking new crypto assets, yield opportunities, or practical blockchain use, the current phase offers both risks and opportunities.
Opportunities:
- Early positioning before confirmed bull market
- Volatility-driven trading strategies
- Accumulation during consolidation
Risks:
- False breakouts
- Profit-taking-driven pullbacks
- Macro trend still bearish
Suggested Approach:
- Avoid over-leveraging
- Focus on staged entry strategies
- Monitor on-chain confirmation signals
Conclusion: A Market at the Edge of Transition
Bitcoin is clearly no longer in a deep bearish phase—but it is not yet in a confirmed bull market either.
The current environment can best be described as:
An early-stage recovery with high volatility and incomplete confirmation
Key levels and signals to watch:
- $70,000 → support stability
- $75,000–$82,000 → short-term expansion zone
- $97,855 → macro trend reversal
- 75% supply in profit → bull confirmation
For investors and builders alike, this is a critical transition period—one that may define the next major cycle in crypto.


