Key Points :
- A historically reliable weekly bottoming signal has reappeared on Solana’s chart
- Similar patterns preceded +1,604% (2023) and +142% (2025) rallies
- Price has broken out above a key resistance around $93.50
- Market data shows early-stage recovery, not full bullish confirmation
- Critical resistance zones: $120 → $145
- Derivatives markets remain cautious, suggesting spot-driven accumulation
1. A Rare Macro Bottom Signal Returns
Solana (SOL) is once again attracting attention among crypto investors and traders after a high-confidence technical signal—previously associated with major price reversals—has reappeared on the weekly chart.
This signal is not just another indicator among many. According to multiple analysts, including WebTrend, it is a high-probability macro bottom formation that has historically preceded explosive upside moves. The same structure was observed in:
- 2023, before a massive +1,604% rally
- 2025, ahead of a +142% price increase
At its core, this signal is defined by a sequence of candlesticks featuring long lower wicks, reflecting persistent buying pressure at lower price levels. In technical terms, this suggests that:
- Sellers are being absorbed
- Demand is consistently stepping in at support
- The market is transitioning from distribution to accumulation
This is not merely a short-term bounce pattern—it is often interpreted as a structural shift in market sentiment, marking the transition from bearish exhaustion to early bullish expansion.
[Weekly Bottoming Signal Structure]
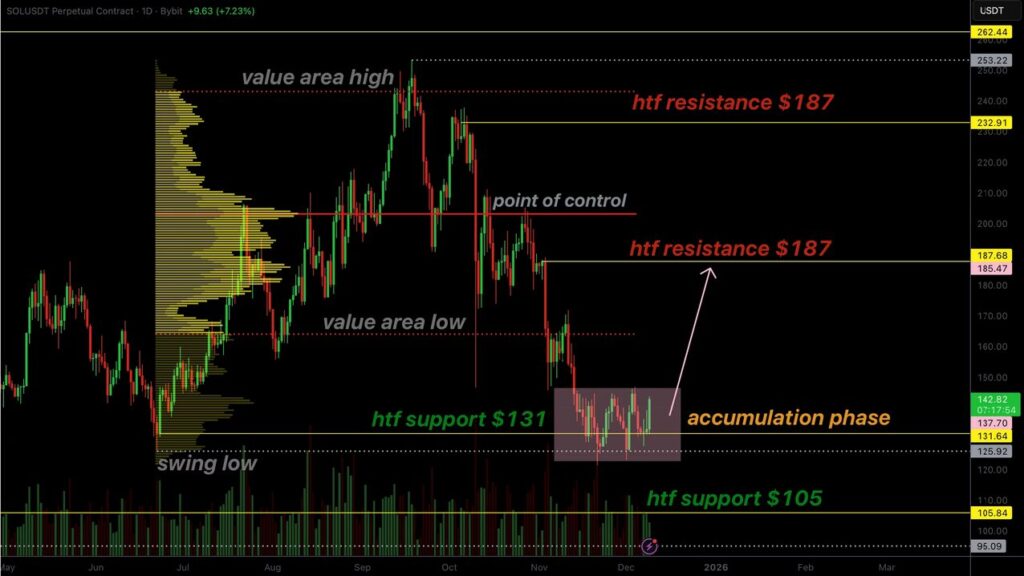
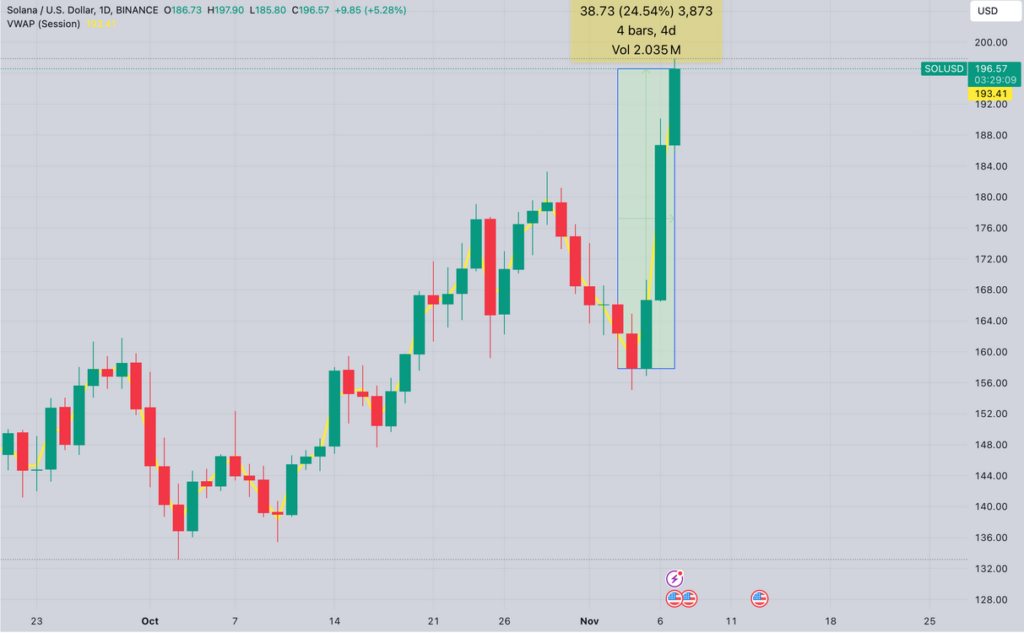
2. Breakout Confirmation: Ascending Triangle in Play
On the daily timeframe, another bullish confirmation appears to be forming. According to trader Bluntz, Solana has likely completed an accumulation phase, followed by a breakout from an ascending triangle pattern.
This pattern is characterized by:
- Rising higher lows (buyers becoming more aggressive)
- A flat resistance level (consistent sell pressure)
When price breaks above this resistance, it often signals:
- Exhaustion of sellers
- Momentum shift toward buyers
- Potential continuation of an uptrend
Solana recently broke above the $93.50 resistance, which previously acted as a strong ceiling. This level is now acting as support, reinforcing the bullish structure.
From a technical perspective, this breakout suggests that:
- Accumulation is complete
- Market participants are repositioning
- A trend continuation phase may be starting
[Ascending Triangle Breakout]
3. Price Targets: Why $120 and $145 Matter
With the breakout confirmed, traders are now focusing on key resistance levels:
$120 – The Structural Pivot
This level acted as a major support zone throughout 2024–2025. If reclaimed, it signals:
- Restoration of bullish market structure
- Increased institutional confidence
- Potential inflows from sidelined capital
$145 – The Momentum Expansion Target
If momentum continues, $145 becomes the next logical target based on:
- Historical resistance zones
- Fibonacci extensions
- Trend continuation models
However, it is important to note that these targets depend on:
- Sustained buying pressure
- Confirmation from derivatives markets
- Broader crypto market conditions (especially BTC and ETH)
4. Market Data: Recovery, But Not Full Bull Mode Yet
Despite bullish price action, derivatives data tells a more cautious story.
Open Interest (OI)
SOL’s open interest remains below $2.3 billion since the February bottom.
Interpretation:
- Traders are not aggressively increasing leverage
- Market confidence is still developing
- Rally is likely driven by spot buying, not speculation
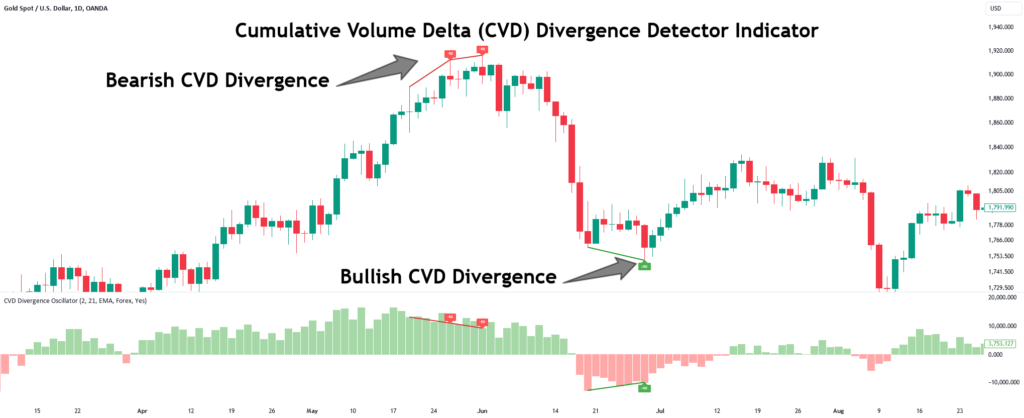
CVD (Cumulative Volume Delta)
- Spot CVD has stabilized → selling pressure is easing
- Futures CVD improved from -$3.5B → -$2.8B
This indicates:
- Reduction in aggressive selling
- Early signs of demand returning
- But no strong buying surge yet
Funding Rates
Funding rates remain neutral, meaning:
- No dominant long or short positioning
- Market indecision persists
[Market Data Overview]
5. What This Means for Investors and Builders
For your target audience—those seeking new assets, yield opportunities, and practical blockchain applications—this setup is particularly important.
For Traders
- Early-stage rallies often offer best risk-reward entries
- Lack of leverage suggests lower liquidation risk
- Break above $120 could trigger momentum acceleration
For Long-Term Investors
- Macro bottom signals historically align with multi-month growth cycles
- Accumulation phases often precede institutional entry
- SOL remains a top Layer-1 with strong developer activity
For Builders and Businesses
Solana’s recovery is not just about price—it reflects:
- Increasing on-chain activity
- Revival of ecosystem projects
- Improved infrastructure stability
Recent trends across the broader crypto ecosystem also support this:
- Growth in real-world asset tokenization (RWA)
- Increased adoption of stablecoin-based payments
- Rising demand for high-throughput chains like Solana
6. Broader Context: Why Solana Matters in 2026
Beyond technical signals, Solana’s position in the crypto landscape is evolving.
Key developments include:
- Continued competition with Ethereum in DeFi and NFTs
- Expansion into payment infrastructure and consumer apps
- Increased interest from institutional players
Compared to previous cycles, this rally—if confirmed—may be driven more by:
- Utility and adoption
- Real transaction volume
- Integration with financial systems
This aligns with a broader industry shift toward practical blockchain use cases, which is directly relevant to your business focus.
Conclusion: A High-Potential Setup, But Confirmation Is Key
Solana’s current setup presents a compelling case:
- A historically reliable bottom signal has reappeared
- A technical breakout confirms bullish structure
- Market data shows early recovery, not full speculation
However, this is still a transition phase, not a confirmed bull run.
The next critical test lies at $120:
- Break and hold → strong bullish continuation
- Rejection → extended consolidation
For investors, this represents a high-potential but still developing opportunity.
For builders and operators, it signals a possible renewed growth phase in the Solana ecosystem.
In previous cycles, similar signals marked the beginning of explosive moves.
Whether history repeats will depend not only on charts—but on real adoption, liquidity flows, and macro crypto conditions.

