Main Points :
- Ethereum has invalidated a bearish pattern and confirmed a bullish breakout above key resistance.
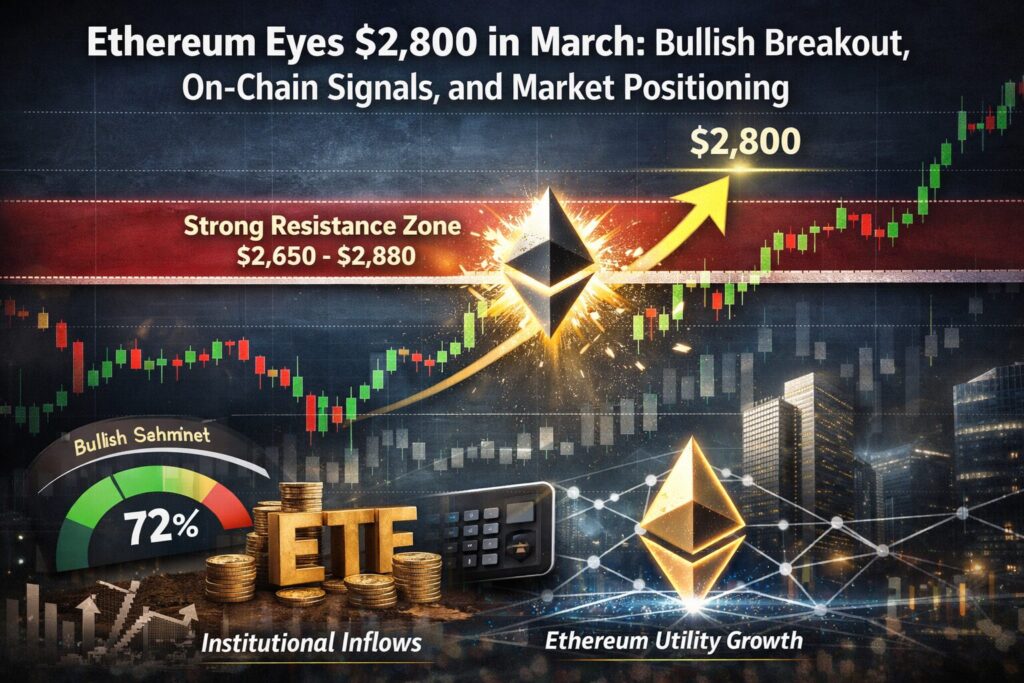
- Technical indicators suggest a potential move toward the $2,800 range (~+26% upside).
- On-chain data highlights strong resistance between $2,650–$2,880 due to historical supply clusters.
- Market sentiment (Polymarket) is shifting bullish, with rising probability of higher price targets.
- The broader context includes institutional flows, ETF narratives, and evolving Ethereum utility.
1. Ethereum Rejects Bearish Structure and Confirms Breakout
Ethereum (ETH) has recently delivered a decisive technical shift that has caught the attention of traders and institutional observers alike. What initially appeared to be a bearish pennant formation on the daily chart was invalidated as ETH broke above its upper trendline near $2,100.
Following this breakout, Ethereum surged nearly 10% in a single day, reaching approximately $2,287—its highest level in six weeks. Importantly, this upward move was accompanied by increased trading volume, reinforcing the credibility of the breakout and suggesting strong market participation rather than a short-lived price spike.
Equally significant is Ethereum’s recovery of two key technical levels: the 20-day exponential moving average (EMA) around $2,072 and the 50-day EMA near $2,210. Reclaiming both indicators simultaneously signals a transition from short-term weakness to renewed bullish momentum.
This structural shift also opens the door to a broader bullish pattern—specifically, a symmetrical triangle breakout. In technical analysis, such formations often precede significant directional moves, especially when supported by volume and trend confirmation.
[ETH Breakout Chart]
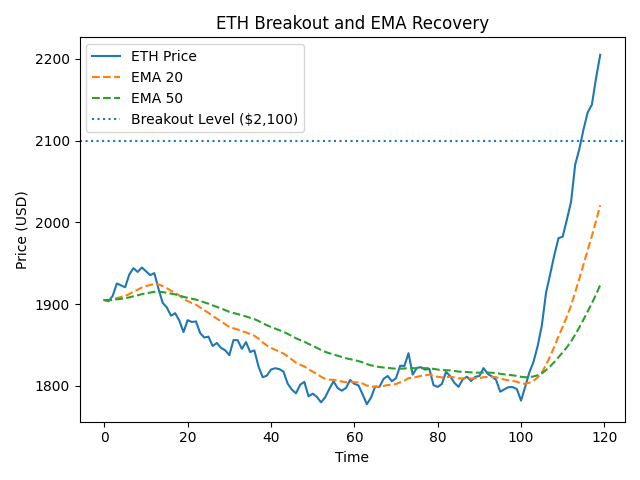
A clean chart showing:
- Breakout above $2,100 trendline
- EMA recovery (20-day and 50-day)
- Volume spike confirmation
2. Technical Projection: Why $2,800 Is a Logical Target
The symmetrical triangle pattern provides a measurable price target based on its height. Applying this methodology to Ethereum’s recent price structure yields an upside target of approximately $2,850.
This aligns closely with the 200-day EMA—a critical long-term trend indicator often used by institutional traders. The convergence of pattern projection and a major moving average strengthens the credibility of the $2,800–$2,850 target zone.
Before reaching that level, however, Ethereum faces an important intermediate resistance around $2,500, corresponding to the 100-day EMA. This level will likely act as a key decision point:
- A clean breakout above $2,500 could accelerate momentum toward $2,800.
- Rejection at this level may trigger a short-term pullback or consolidation phase.
From a trading strategy perspective, this creates a clear structure:
- Support zone: ~$2,100–$2,200
- Mid resistance: ~$2,500
- Target zone: ~$2,800
This clarity is particularly valuable for traders seeking structured risk-reward setups.
3. On-Chain Data: Hidden Resistance Above
While technical indicators paint a bullish picture, on-chain data introduces a more nuanced perspective.
Ethereum is currently trading within a wide valuation band defined by:
- Lower bound (MVRV band): ~$1,650
- Realized price: ~$2,350
Historically, when ETH rebounds from lower MVRV levels and breaks above its realized price, it often encounters resistance at the next MVRV band above. This suggests a potential ceiling around $2,650 in the current cycle.
Even more critical is the UTXO Realized Price Distribution (URPD) data, which reveals a dense supply cluster between $2,770 and $2,880. In this range, investors previously accumulated over 7.9 million ETH.
This has two implications:
- Many holders may sell at breakeven, creating resistance.
- The zone becomes a psychological barrier due to historical positioning.
At the same time, cost-basis heatmaps show another accumulation cluster near $2,800, indicating that price could be magnetized toward this level—even if only temporarily.
[On-Chain Supply Distribution Heatmap]
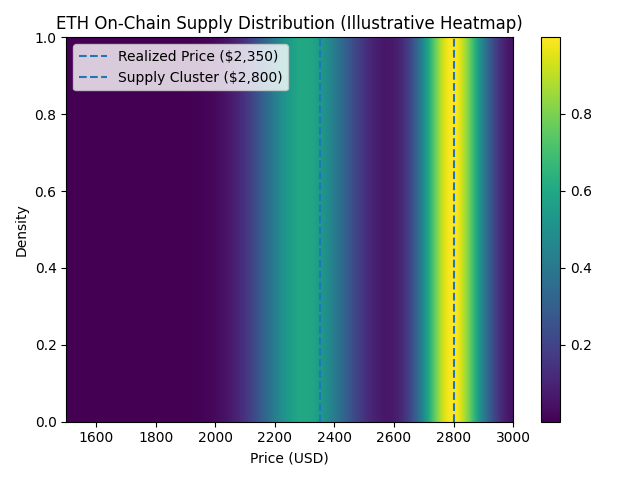
A heatmap-style visualization showing:
- Dense supply cluster at $2,770–$2,880
- Realized price at $2,350
- Lower MVRV band at $1,650
4. Market Sentiment: Polymarket Signals a Bullish Shift
Beyond technical and on-chain data, market sentiment is increasingly aligning with a bullish outlook.
According to Polymarket:
- Probability of ETH reaching $2,800 in March: ~13% (rising rapidly)
- Probability of reaching $2,600: ~32%
- Probability of reaching $2,400: ~69%
At the same time, downside probabilities (e.g., $1,800 or $1,600 scenarios) have declined significantly, indicating reduced bearish expectations.
This shift reflects a broader market psychology:
- Traders are repositioning toward upside scenarios.
- Risk appetite is gradually returning.
- Short-term narratives are turning constructive.
Prediction markets are particularly useful because they aggregate real-money expectations rather than opinions, making them a valuable sentiment indicator.
5. Broader Context: Why Ethereum’s Upside Matters Now
Ethereum’s potential move toward $2,800 is not happening in isolation. Several macro and industry-level factors are contributing to the current setup:
Institutional Positioning
Ethereum is increasingly viewed as:
- A settlement layer for tokenized assets
- A backbone for decentralized finance (DeFi)
- A key player in real-world asset (RWA) tokenization
ETF and Regulatory Narratives
Following Bitcoin ETF approvals, market participants are speculating about:
- Ethereum ETF expansion
- Increased institutional exposure
- Regulatory clarity improving capital inflows
Network Fundamentals
Recent developments in Ethereum’s ecosystem include:
- Layer 2 scaling adoption
- Lower transaction costs
- Improved developer activity
These factors strengthen Ethereum’s long-term investment case, even if short-term resistance remains.
6. Strategic Implications for Investors and Builders
For crypto investors and builders, the current Ethereum setup offers several actionable insights:
For Traders
- Watch $2,500 as a breakout trigger
- Use $2,100–$2,200 as structural support
- Anticipate volatility near $2,800
For Long-Term Investors
- Accumulation below realized price ($2,350) historically offers favorable risk-reward
- Resistance zones should be seen as distribution—not necessarily trend reversal
For Builders and Operators
- Ethereum’s upward momentum often correlates with:
- Increased DeFi activity
- Higher on-chain transaction volumes
- Greater user engagement
For platforms like wallets, payment systems, or VASP operations, this implies potential growth in:
- Transaction flow
- User onboarding
- Revenue opportunities
[ETH Price Scenario Flow Diagram]
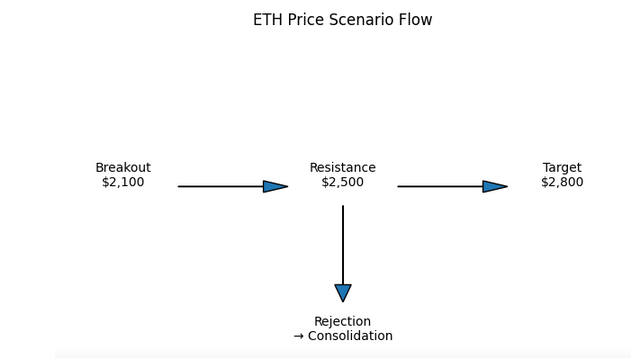
A simple flow diagram:
- Breakout → $2,500 test → $2,800 target
- Rejection → consolidation → reattempt
Conclusion
Ethereum’s current market structure represents a compelling intersection of technical strength, improving sentiment, and underlying fundamental support.
The invalidation of a bearish pattern, combined with strong volume and EMA recovery, suggests that the market is transitioning into a more constructive phase. Technical projections point toward the $2,800 range, while on-chain data highlights both the potential and the challenges of reaching that level.
Importantly, the presence of dense supply zones near $2,800 does not necessarily negate the bullish case—it simply defines the battleground where buyers and sellers will compete most intensely.
For investors, this is a moment of opportunity—but also one that requires discipline. For builders, it is a signal that Ethereum’s ecosystem may be entering another phase of expansion, with increased demand for real-world applications and infrastructure.
Ultimately, whether Ethereum reaches $2,800 in March or not, the broader trend is clear: the network continues to strengthen its position as a foundational layer of the digital asset economy.


