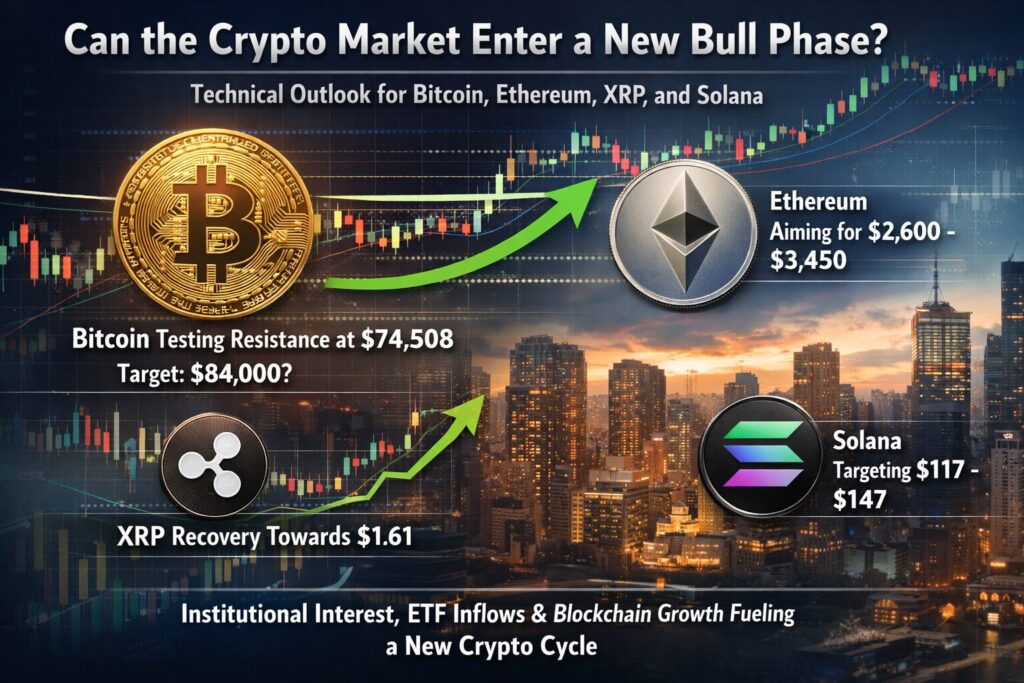
Main Points :
- Bitcoin is testing a major resistance near $74,508, with a potential breakout pattern that could target $84,000.
- Ethereum has broken out of a consolidation range and may move toward $2,600 and $3,450 if momentum continues.
- XRP is showing signs of recovery above its 50-day moving average, with a possible move toward $1.61.
- Solana is approaching a critical resistance around $95, with a bullish scenario targeting $117 and potentially $147.
- Broader market indicators suggest that institutional interest, ETF inflows, and expanding blockchain applications may support a new cycle of crypto growth.
Introduction: A Market at a Critical Turning Point
The cryptocurrency market may once again be approaching a decisive moment. After periods of consolidation and volatility, several major digital assets are showing technical signals that suggest the possibility of a renewed bullish phase. Traders and investors are closely watching key resistance levels and technical indicators to determine whether the current momentum represents a temporary rally or the beginning of a broader market cycle.
Bitcoin, Ethereum, XRP, and Solana—four of the most widely traded and influential cryptocurrencies—are currently testing critical price levels. If these levels are broken convincingly, they could trigger a chain reaction of buying activity across the broader market.
For investors searching for new crypto opportunities, passive income strategies, or practical blockchain applications, understanding these technical signals can provide valuable insight into the potential direction of the digital asset ecosystem.
Bitcoin Price Analysis: The $74,500 Resistance Battle
Bitcoin has been steadily climbing and recently reached a critical resistance level around $74,508. This price zone has historically attracted strong selling pressure, meaning that the market is likely to experience an intense battle between buyers and sellers.
Technical indicators currently favor the bulls. The 20-day exponential moving average (EMA) is beginning to slope upward, suggesting strengthening momentum. Meanwhile, the Relative Strength Index (RSI) has moved into positive territory, signaling growing buying pressure.
These indicators hint that buyers are attempting to seize control of the market.
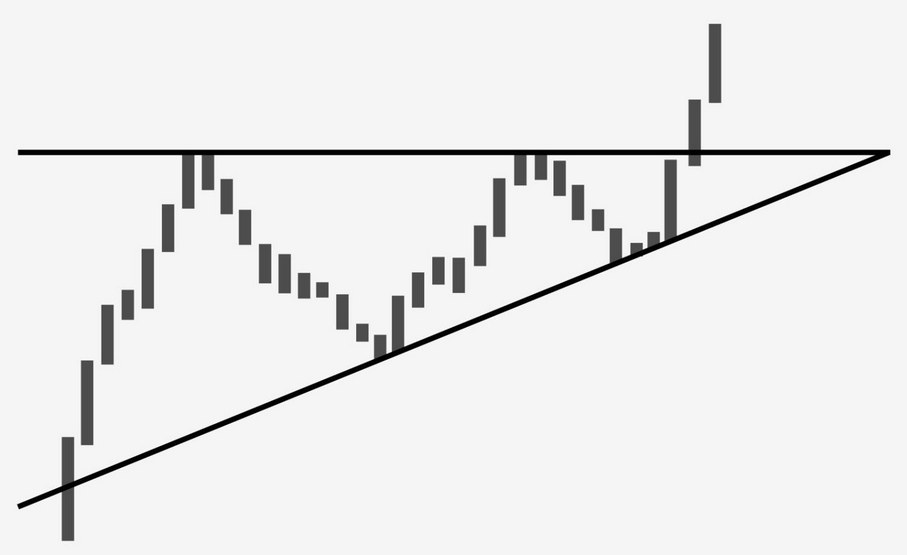
The Ascending Triangle Pattern
Bitcoin’s current price action appears to be forming a classic ascending triangle pattern, a bullish continuation formation in technical analysis. This structure develops when the market repeatedly tests a horizontal resistance level while forming higher lows.
If Bitcoin successfully closes above $74,508, the pattern would confirm a breakout and potentially open the door to a rally toward $84,000.
Such a move would be significant because it would strongly suggest that the previous downtrend has ended.
Downside Risk Scenario
However, the bullish scenario is not guaranteed.
If sellers manage to push the price back below the moving averages, Bitcoin could experience a rapid decline toward the ascending trendline support. A break below this support would shift market sentiment back in favor of the bears.
This means that the next few weeks could determine whether Bitcoin enters a new expansion phase or remains trapped in a consolidation cycle.
[“Bitcoin Resistance Breakout Scenario”]
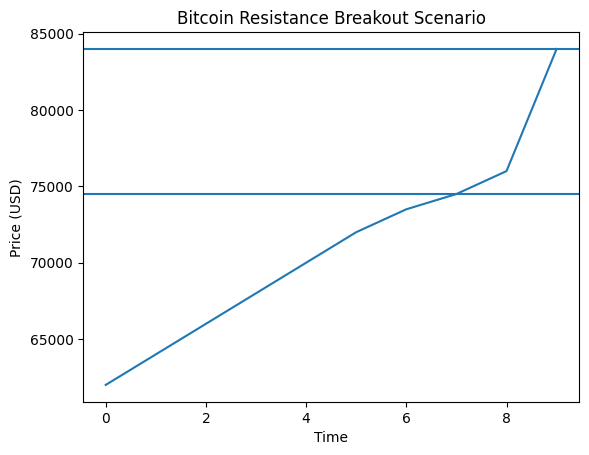
Graph description:
- X-axis: Time
- Y-axis: Price ($)
- Resistance: $74,508
- Breakout Target: $84,000
- Support: ascending trendline
Ethereum Price Analysis: Signs of Momentum Return
Ethereum recently resolved a long period of sideways trading between $1,750 and $2,111 by breaking above the range ceiling. This breakout suggests that the consolidation phase may have ended and that bullish momentum is returning.
Technical indicators reinforce this outlook.
Ethereum’s moving averages are approaching a golden cross, a widely watched signal that occurs when a shorter-term moving average crosses above a longer-term average. Historically, golden crosses often precede extended upward trends in both traditional and crypto markets.
The RSI indicator is also in positive territory, further supporting the argument that buyers are regaining control.
Potential Upside Targets
If Ethereum maintains its current momentum, analysts expect the next resistance levels to appear near:
- $2,600
- $3,450
Reaching these targets would confirm that Ethereum likely formed a major bottom near $1,747.
For long-term investors, this would mark a potential shift from accumulation toward expansion.
Key Support Level
The 20-day EMA near $2,072 is now an important support level.
If the price falls below this level, it would indicate that sellers are still active at higher prices. In that case, Ethereum could retrace toward $1,916 before attempting another breakout.
[“Ethereum Breakout from Consolidation Range”]
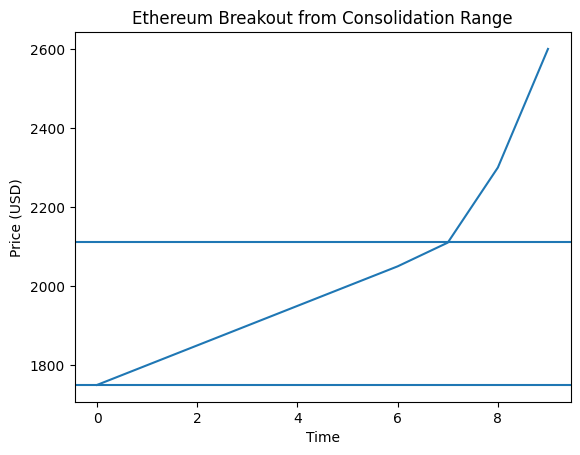
Graph description:
- Consolidation range: $1,750 – $2,111
- Breakout point above $2,111
- Targets: $2,600 → $3,450
XRP Price Analysis: Recovery After a Long Correction
XRP, the digital asset associated with Ripple’s payment network, has also begun showing signs of recovery. The price recently moved above its 50-day simple moving average (SMA) near $1.46, suggesting renewed buying activity.
Moving averages often act as psychological indicators for traders. When a cryptocurrency climbs above a widely followed moving average, it can trigger algorithmic trading signals and attract additional capital.
Next Resistance Level
If XRP manages to hold above the 50-day SMA, the next target is likely the $1.61 level, which previously served as a breakdown point.
Even if the price encounters resistance there, bullish sentiment may remain intact as long as the market finds support near the 20-day EMA around $1.41.
Under this scenario, XRP could eventually climb toward its descending trendline resistance.
Bearish Scenario
If XRP fails to maintain momentum and falls below the 20-day EMA, it would signal that sellers are aggressively defending higher levels.
In that case, the price may continue moving within its descending channel, prolonging the recovery process.
Solana Price Analysis: A Test of the $95 Barrier
Solana has emerged as one of the most dynamic ecosystems in the crypto industry, particularly in areas such as decentralized finance (DeFi), NFTs, and high-speed blockchain infrastructure.
From a technical perspective, Solana is now approaching a critical resistance level around $95.
This level has previously acted as a strong selling zone, making it a crucial test for the asset’s bullish momentum.
Bullish Scenario
If buyers successfully push the price above $95, the next major target could be $117.
Although sellers are likely to defend this level aggressively, a healthy pullback that holds above $95 would confirm that the breakout is legitimate.
In such a scenario, the market could eventually aim for $147.
Range-Bound Scenario
On the other hand, if Solana sharply reverses and falls below the 20-day EMA near $87, the price may remain trapped within a $76 to $95 trading range for a longer period.
This would suggest that the market still requires additional accumulation before initiating a sustained rally.
[“Solana Breakout Potential”]
Graph description:
- Resistance: $95
- Target: $117
- Extended target: $147
- Range scenario: $76 – $95
Broader Market Trends Supporting a Bullish Cycle
Beyond technical charts, several macro-level developments are strengthening the case for a potential crypto bull cycle.
Institutional Adoption
Major financial institutions continue expanding their exposure to digital assets. Spot Bitcoin ETFs, institutional custody services, and regulated crypto trading platforms are making the asset class more accessible to traditional investors.
These developments increase liquidity and reduce barriers for large capital inflows.
Blockchain Infrastructure Expansion
Layer-1 and Layer-2 networks are rapidly evolving to support real-world applications, including:
- Cross-border payments
- Tokenized assets
- Decentralized finance platforms
- On-chain identity systems
Networks such as Ethereum and Solana are becoming critical infrastructure for these innovations.
Stablecoins and Payment Networks
Stablecoins are increasingly used in global payment systems, particularly in emerging markets where traditional banking infrastructure is limited.
This growing real-world utility reinforces the long-term value proposition of blockchain technology.
Conclusion: Is the Next Crypto Bull Market Beginning?
The current technical landscape suggests that the cryptocurrency market may be approaching a pivotal moment.
Bitcoin is testing a major resistance level that could trigger a breakout toward $84,000. Ethereum has already broken out of consolidation and may be preparing for a move toward $2,600 and beyond. XRP is recovering above key moving averages, while Solana is challenging a resistance zone that could lead to significant upside if broken.
While short-term volatility remains inevitable, the combination of bullish technical signals, growing institutional participation, and expanding real-world blockchain applications creates a powerful foundation for the next phase of the crypto market.
For investors seeking new digital assets, emerging revenue opportunities, or practical blockchain use cases, closely monitoring these technical developments may provide a strategic advantage in navigating the rapidly evolving cryptocurrency ecosystem.


