
Main Points :
- A macro model combining the U.S. 10-year Treasury yield and China’s 10-year government bond yield is showing a bullish signal historically linked to Bitcoin market bottoms.
- The model’s Stochastic RSI bullish crossover has previously preceded major Bitcoin bull cycles including 2013, 2017, and 2020–2021.
- Large Bitcoin holders (“whales”) are accumulating again, a pattern that historically appears near market bottoms.
- Technical indicators such as the 100-week moving average and oversold RSI suggest the market may be stabilizing.
- If momentum continues, Bitcoin could potentially revisit the $100,000 level, although key resistance levels must first be broken.
Introduction: Macro Signals Suggest Bitcoin May Be Near a Market Bottom
Bitcoin, the world’s largest cryptocurrency by market capitalization, may be approaching another major turning point. A macroeconomic model based on the interaction between U.S. and Chinese government bond yields suggests that Bitcoin could be nearing the end of its recent correction and preparing for a new upward cycle.
The model combines the 10-year U.S. Treasury yield (US10Y) and the 10-year Chinese government bond yield (CN10Y) and then applies a Stochastic RSI indicator to the product of those yields. According to analysts who have studied the pattern, bullish signals generated by this indicator have historically coincided with major Bitcoin market bottoms.
If the historical pattern repeats, Bitcoin could experience a significant upward movement in the coming months, potentially revisiting the psychologically important $100,000 price level.
Beyond the macro model, several other factors—including whale accumulation, technical indicators, and broader institutional adoption—are reinforcing the narrative that Bitcoin’s long-term bullish cycle may still be intact.
Macro Bond Yield Model: A Signal That Historically Marks Bitcoin Bottoms
Key Insight
A macro indicator combining U.S. and Chinese bond yields is showing a bullish crossover historically linked to Bitcoin bull markets.
One of the most intriguing elements of the recent analysis is the macroeconomic model that multiplies the U.S. 10-year Treasury yield with China’s 10-year government bond yield. This product reflects global liquidity conditions and the broader macroeconomic environment affecting risk assets.
When the Stochastic RSI applied to this yield product produces a bullish crossover from oversold territory, Bitcoin has historically entered major bull cycles.
The pattern has appeared before several of the largest Bitcoin rallies in history:
- 2013 bull market: Bitcoin surged roughly 8,700% after the signal.
- 2017 bull market: Bitcoin rose around 1,900%.
- 2020–2021 cycle: Bitcoin gained more than 600%.
- 2023 recovery: Bitcoin rallied over 350% from its lows.
These previous occurrences suggest that macroeconomic conditions captured by this indicator may be closely linked to shifts in global risk appetite and liquidity flows.
Why the U.S.–China Yield Relationship Matters
The United States and China represent the two largest economies in the world. Their sovereign bond yields reflect expectations around inflation, monetary policy, and global capital flows.
When these yields move in certain patterns, they signal changes in the broader financial environment that can affect speculative and growth-oriented assets such as Bitcoin.
For example:
- Rising yields can signal tighter financial conditions.
- Falling yields can indicate monetary easing and liquidity expansion.
When the combined yield model reaches oversold levels and turns upward, it may suggest that the macro environment is becoming more supportive for risk assets.
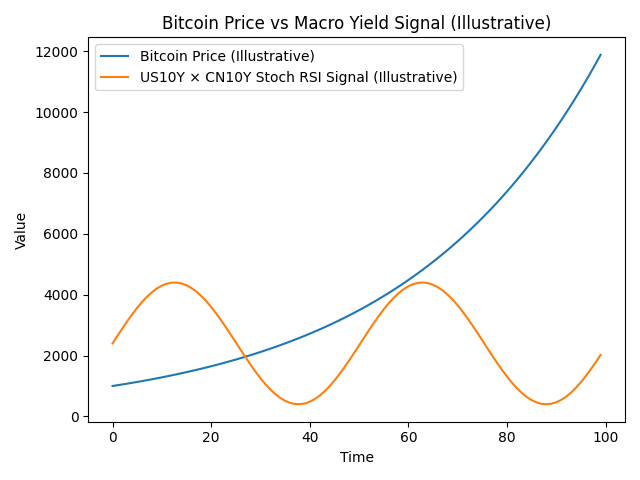
Description:
A chart comparing Bitcoin price movements with the Stochastic RSI of the US10Y × CN10Y yield product. Highlight the bullish crossover points in 2013, 2017, 2020, 2023, and the current signal.
Whale Accumulation: Large Investors Are Buying Again
Key Insight
Bitcoin wallets holding 1,000 to 10,000 BTC have resumed accumulation during the recent market dip.
On-chain data further supports the idea that Bitcoin may be forming a market bottom. Large holders—often referred to as “whales”—have begun accumulating Bitcoin again after recent price declines.
These investors typically control significant capital and often act strategically during market downturns. Historical data shows that whale accumulation phases frequently occur near major cycle bottoms.
Wallets holding between 1,000 BTC and 10,000 BTC have recently increased their holdings, suggesting that institutional or high-net-worth investors may be positioning themselves for a future rally.
Historical Pattern of Whale Behavior
Whale accumulation has appeared before several major Bitcoin rallies:
- Early 2023: whales began buying near cycle lows before Bitcoin rose more than 350%.
- 2017 bull run: large wallets accumulated during the consolidation phase.
- 2020 cycle: accumulation preceded the explosive rally to over $60,000.
These patterns indicate that large investors tend to accumulate when market sentiment is pessimistic and prices are relatively low.
For many analysts, whale accumulation is one of the most reliable on-chain signals for identifying market bottoms.
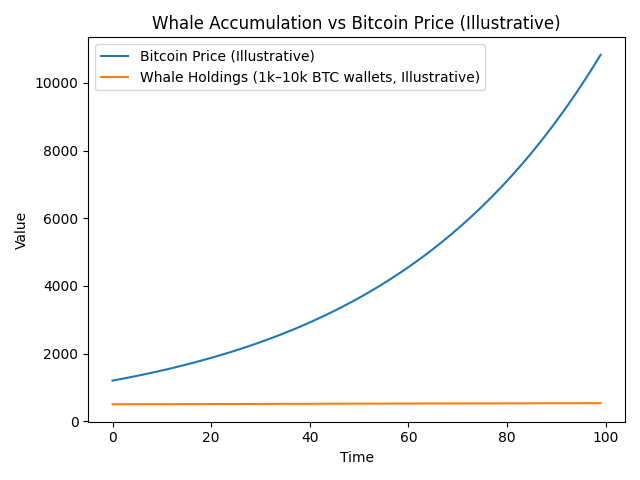
Description:
Chart showing Bitcoin price vs whale wallet holdings (1k–10k BTC) highlighting accumulation phases before major bull markets.
Technical Indicators: Signs of an Early Recovery
Key Insight
Several technical indicators suggest that Bitcoin may already be stabilizing after its recent decline.
Technical analysis of Bitcoin’s weekly chart reveals several encouraging signals.
100-Week Moving Average Support
Over the past month, bearish traders have been unable to push Bitcoin decisively below the 100-week simple moving average (100W SMA).
This level has historically acted as a strong support zone during previous market cycles.
Examples include:
- March 2020: Bitcoin rebounded from this level and later rallied more than 1,000%.
- 2019: a similar bounce led to a 300% price increase.
Holding above this moving average suggests that long-term market structure remains intact.
Oversold RSI
Bitcoin’s Relative Strength Index (RSI) has also entered oversold territory below 30.
An oversold RSI typically indicates that selling pressure may be exhausted and that a rebound could occur as traders begin buying the dip.
When oversold RSI conditions coincide with strong support levels, the probability of a technical rebound increases.
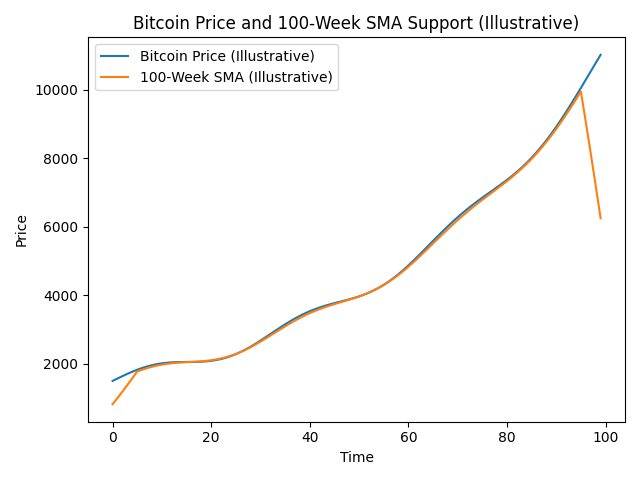
Description:
Weekly Bitcoin chart showing the 100-week SMA support line, RSI oversold levels, and historical rebounds.
The Path Toward $100,000
Key Insight
If Bitcoin maintains support levels, technical targets suggest a potential move toward $100,000.
Should Bitcoin continue to hold its long-term support levels, the next major price target lies near $100,000.
This level corresponds with several important technical indicators:
- The 50-week moving average.
- The Fibonacci 1.618 extension level.
- A historical resistance zone formed during previous rallies.
Analysts suggest that Bitcoin could approach this level by late summer, assuming macro conditions remain favorable.
However, markets rarely move in straight lines. Bitcoin must first overcome several resistance levels.
Key Resistance Level: $78,000
One critical level is around $78,000.
If Bitcoin fails to break above this resistance convincingly, some analysts warn that the current rally attempt could become a bull trap, where prices temporarily rise before falling again.
Key Support Levels
On the downside, important support levels include:
- Around $68,300, near the 200-week exponential moving average.
- A broader support zone between $60,000 and $65,500.
Maintaining these levels would help preserve the long-term bullish outlook.
Broader Market Trends Supporting Bitcoin
Institutional Adoption Continues
In recent years, Bitcoin has increasingly been integrated into the traditional financial system.
Several developments have reinforced this trend:
- Spot Bitcoin ETFs launched in major markets.
- Large asset managers and banks offering crypto custody services.
- Growing interest in Bitcoin as a macro hedge against monetary instability.
These structural changes mean that Bitcoin’s market dynamics are increasingly influenced by institutional capital flows.
Global Liquidity Cycles
Bitcoin’s performance has historically been tied to global liquidity conditions.
Periods of expanding liquidity—often associated with lower interest rates and monetary easing—tend to benefit risk assets.
If central banks eventually shift toward more accommodative policies, Bitcoin could benefit from renewed capital inflows.
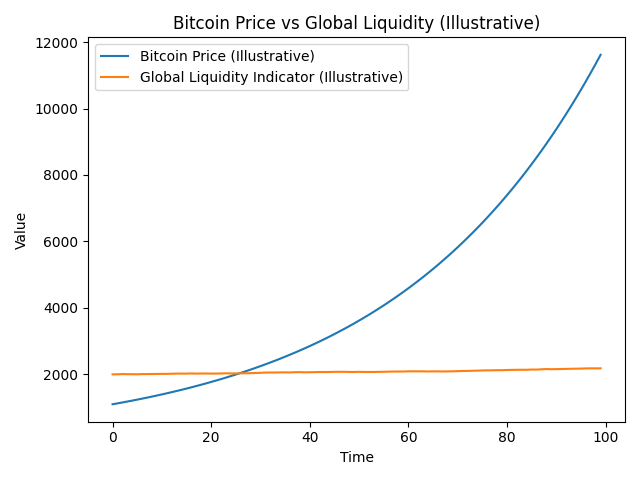
Description:
Chart comparing Bitcoin price with global liquidity indicators or central bank balance sheets.
Risks and Uncertainties
Despite the optimistic outlook suggested by the macro model, several risks remain.
Regulatory Pressure
Cryptocurrency markets continue to face regulatory scrutiny in many jurisdictions. New rules affecting exchanges, stablecoins, or custodial services could influence market sentiment.
Macroeconomic Shocks
Unexpected macroeconomic events—such as geopolitical tensions, financial crises, or sudden interest rate increases—could also disrupt bullish scenarios.
Market Volatility
Bitcoin remains a highly volatile asset, and large price swings can occur even during long-term bull markets.
Investors should therefore consider risk management strategies when navigating cryptocurrency markets.
Conclusion: A Confluence of Signals Suggests Bitcoin May Be Near a Turning Point
Bitcoin’s recent market behavior is generating increasing interest among analysts and investors.
A macroeconomic model combining U.S. and Chinese bond yields has produced a bullish signal historically associated with major Bitcoin market bottoms. At the same time, whale accumulation, strong technical support levels, and improving macro conditions are reinforcing the possibility that the cryptocurrency may be approaching the next phase of its long-term cycle.
While significant resistance levels remain ahead, the convergence of macro, on-chain, and technical signals suggests that Bitcoin could be entering a period of renewed strength.
If historical patterns continue to hold, the coming months could determine whether Bitcoin is preparing for another major rally—potentially bringing the price back toward the $100,000 milestone.
For investors and builders in the blockchain ecosystem, such developments could have profound implications, influencing not only the cryptocurrency market but also the broader adoption of decentralized technologies.


