Main Points :
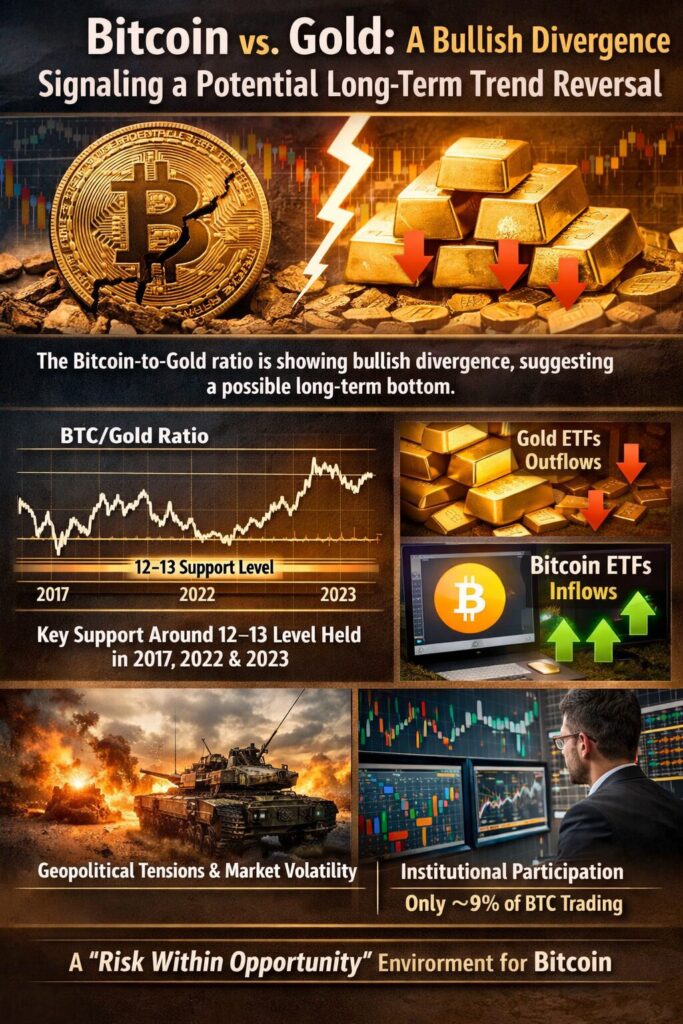
- The Bitcoin-to-Gold ratio is showing bullish divergence, suggesting weakening selling pressure and a possible long-term bottom.
- Key historical support around 12–13 in the BTC/Gold ratio has held, the same level that marked major turning points in 2017, 2022, and 2023.
- Capital flows are diverging: Gold ETFs recently saw massive outflows while Bitcoin ETFs are experiencing renewed inflows.
- The current macro environment—including geopolitical tensions and financial market volatility—may create a “risk within opportunity” scenario for Bitcoin.
- Institutional participation via Bitcoin ETFs is growing, but it still represents only about 9% of total BTC market trading, leaving significant room for expansion.
The Bitcoin-Gold Ratio: A Signal Worth Watching
For decades, gold has been considered the ultimate store of value—a safe-haven asset during times of financial instability and geopolitical tension. Bitcoin, often described as “digital gold,” has increasingly been compared to the precious metal as investors evaluate its role in modern portfolios. One of the most revealing indicators of this competition between traditional and digital stores of value is the Bitcoin-to-Gold ratio, a metric that compares the price performance of Bitcoin relative to gold.
Recent market analysis suggests that this ratio may be sending a strong bullish signal. After correcting to levels similar to those seen during major turning points in previous cycles—specifically in 2017, 2022, and 2023—the ratio now appears to be forming a structure that analysts interpret as a potential long-term bottom.
Analysts describe the current market environment as “risk within opportunity.” In other words, while macroeconomic uncertainty and geopolitical tensions remain elevated, these very conditions may be creating the foundation for Bitcoin’s next phase of growth relative to traditional safe-haven assets.
Bullish Divergence in the Bitcoin-Gold Ratio
A key technical development driving this outlook is the appearance of a bullish divergence between price action and momentum indicators on the Bitcoin-to-Gold chart.
y = \frac{Price_{BTC}}{Price_{Gold}}
In technical analysis, bullish divergence occurs when the price of an asset forms lower lows while a momentum indicator—such as the Relative Strength Index (RSI)—forms higher lows. This structure suggests that although prices are declining, the underlying selling pressure is weakening.
According to market analysts including Michaël van de Poppe, founder of MN Capital, this divergence recently appeared on the daily chart of the BTC/Gold ratio, hinting that the downtrend may be losing momentum.
The ratio corrected earlier this year toward the 12–13 support range, an area that has historically played an important role in the market.
- In 2017, this level acted as resistance.
- In 2022 and 2023, it flipped into a strong support zone.
Because the market has now revisited this level again, analysts believe it may represent a structural bottom in Bitcoin’s long-term performance relative to gold.
[BTC/Gold Ratio Long-Term Chart]
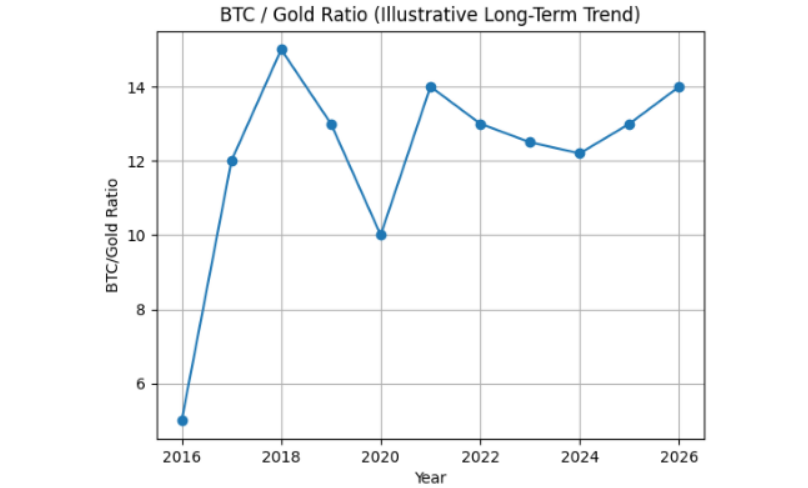
Suggested chart:
BTC/Gold ratio (2016–present) highlighting support around 12–13 and RSI divergence.ETF Capital Flows Are Telling a New Story
Another factor reinforcing the bullish case for Bitcoin relative to gold is the recent shift in ETF capital flows.
Exchange-traded funds have become one of the most important bridges connecting institutional investors to both commodities and digital assets. Changes in their inflows and outflows often reveal how large investors are repositioning their portfolios.
Recent data shows a clear divergence:
Gold ETF Outflows
One of the world’s largest gold ETFs, SPDR Gold Shares (GLD), recently experienced a dramatic capital withdrawal.
- On March 6, GLD recorded approximately $3 billion in outflows in a single day.
- According to market analysts, this was more than 200% larger than any single-day outflow seen in the previous two years.
Such a large withdrawal suggests that institutional investors may be reducing exposure to gold—at least temporarily—possibly reallocating capital into other asset classes.
[Gold ETF Flows]
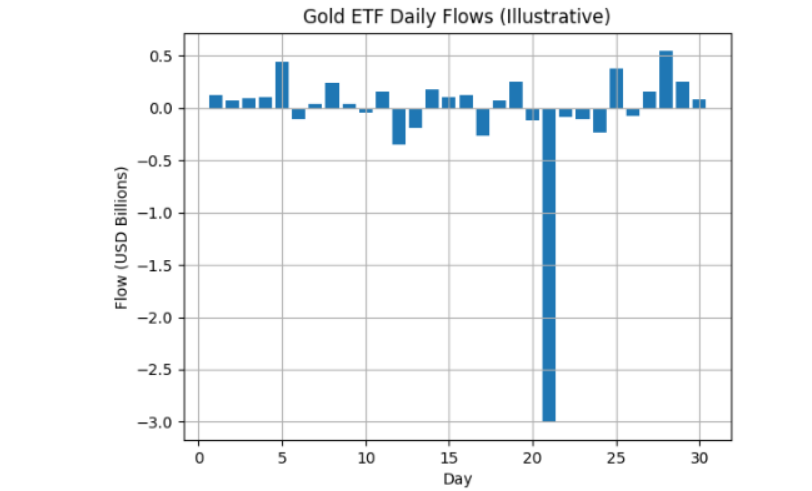
Suggested chart:
Daily flows of GLD ETF showing the large $3B outflow spike.
Bitcoin ETF Inflows Recover
At the same time, Bitcoin ETFs appear to be regaining momentum.
Recent data indicates that 30-day net inflows into Bitcoin ETFs have reached approximately $906 million, representing a sharp recovery from the $1.9 billion outflow recorded just one month earlier.
Holdings data tells a similar story.
- Bitcoin ETF balances improved from –34,197 BTC to +12,909 BTC over the past month.
- Meanwhile, gold ETF holdings dropped significantly—from about 1.4 million ounces to roughly 606,850 ounces during the same period.
This divergence suggests a gradual reallocation of capital from traditional safe-haven assets toward digital assets.
[Bitcoin ETF Flows]
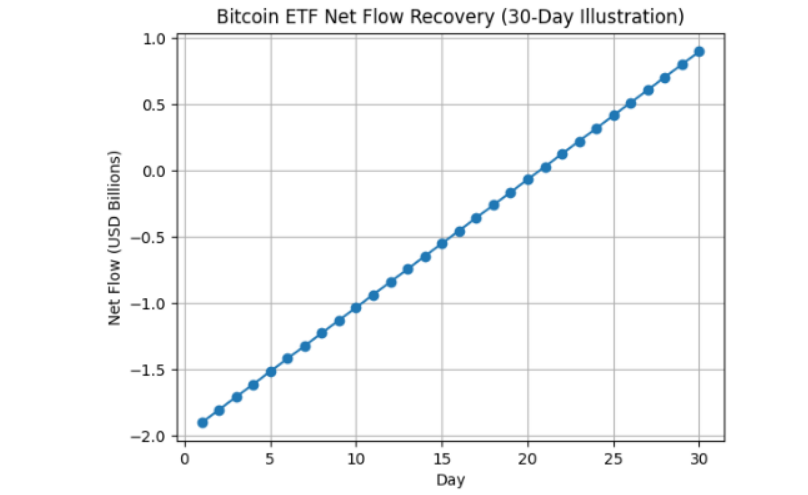
Suggested chart:
30-day Bitcoin ETF net flows turning from negative to positive.
Macroeconomic Volatility: Risk and Opportunity
The broader macroeconomic environment is also playing a significant role in Bitcoin’s current market dynamics.
According to research from Binance Research, global financial markets are experiencing heightened volatility due to geopolitical developments and macroeconomic uncertainty. Events such as tensions involving the United States, Israel, and Iran have increased uncertainty across multiple asset classes.
During these periods, Bitcoin has sometimes traded in correlation with macro assets such as:
- Oil
- U.S. equities
- Global risk assets
This correlation highlights Bitcoin’s evolving role in the financial system. While it was once viewed primarily as a speculative asset, it is increasingly being treated as part of the global macro trading landscape.
However, this volatility also creates opportunity. In unstable environments, investors often seek assets that offer asymmetric upside potential. Bitcoin, with its limited supply and growing institutional infrastructure, fits this profile.
Institutional Adoption Still Has Room to Grow
Despite growing institutional interest, Bitcoin adoption among large investors remains relatively early compared to traditional financial markets.
Currently:
- Bitcoin ETFs account for roughly 9% of total Bitcoin spot market trading volume.
In contrast:
- ETFs represent 30–40% of total trading volume in the U.S. stock market.
This comparison suggests that institutional participation in Bitcoin markets could still expand dramatically over the coming years.
As more financial institutions integrate digital asset services—such as custody, trading, and structured products—the share of Bitcoin trading conducted through regulated investment vehicles may rise significantly.
[ETF Share Comparison]
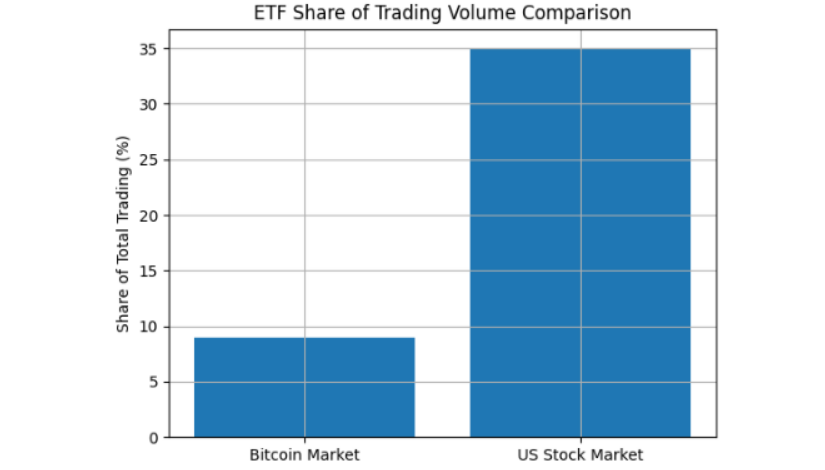
Suggested chart:
ETF share of trading volume
- Bitcoin market: ~9%
- U.S. equities: 30–40%
Historical Market Cycles and Political Events
Historical data also suggests that periods of geopolitical and political uncertainty can be followed by strong market recoveries.
For example, during U.S. midterm election years, the S&P 500 has historically experienced notable corrections.
- Average decline from peak to trough: 16%
Bitcoin, being a more volatile asset, has historically experienced deeper corrections during similar cycles.
- Average decline: 56%
However, the recovery phase following these events has often been strong.
Since 1939, the S&P 500 has never produced a negative return during the 12 months following a midterm election, with an average gain of 19%.
Bitcoin’s historical performance has been even more dramatic.
Across the three midterm election cycles since Bitcoin began trading, the cryptocurrency recorded average gains of approximately 54% during the following year.
This historical context suggests that periods of market stress may actually precede powerful rallies.
The Strategic Role of Bitcoin in Modern Portfolios
The emerging dynamics between Bitcoin and gold highlight an important shift in how investors view stores of value.
Gold remains an important hedge against inflation and geopolitical risk. However, Bitcoin offers characteristics that appeal to a new generation of investors:
- Fixed supply (21 million coins)
- Global liquidity
- Digital transferability
- Increasing institutional accessibility via ETFs and custodians
For investors searching for new revenue opportunities or emerging assets, the Bitcoin-to-Gold ratio provides an intriguing signal.
If the ratio has indeed reached a long-term bottom, it could imply that Bitcoin is entering a period of outperformance relative to gold.
Conclusion
The recent behavior of the Bitcoin-to-Gold ratio, combined with ETF capital flows and macroeconomic trends, suggests that a significant shift may be underway in global asset markets.
Technical indicators point to a possible bullish divergence, while capital flows reveal a gradual movement of institutional money away from gold and back into Bitcoin. At the same time, macroeconomic volatility and geopolitical uncertainty may be creating the very conditions that allow Bitcoin to strengthen its position as a modern store of value.
Perhaps most importantly, institutional participation in Bitcoin remains far below the levels seen in traditional financial markets. As regulatory frameworks mature and infrastructure improves, the digital asset market could attract substantially larger pools of capital.
For investors focused on discovering new crypto assets, revenue opportunities, and practical blockchain applications, the evolving relationship between Bitcoin and gold is more than just a technical indicator—it may be a window into the future structure of global finance.
If current signals hold true, the coming years could mark a decisive chapter in the long-standing debate between physical gold and digital gold.