
Main Points :
- Bitcoin has rebounded roughly 17% from sub-$60,000 lows, entering what analysts call a “relief rally.”
- Market data suggests buyers are returning, especially in derivatives markets.
- Spot Bitcoin ETFs have seen renewed inflows, totaling more than $529 million in recent days.
- However, analysts say the broader bearish trend will not fully reverse unless Bitcoin breaks above $78,000.
- Key technical levels such as the $68,300 (200-week EMA) and $54,400 realized price remain critical support zones.
The Bitcoin Relief Rally: A Temporary Bounce or the Beginning of a New Bull Phase?
Bitcoin has staged a notable rebound in recent weeks, recovering approximately 17% from lows below $60,000 and climbing back toward the $74,000 range. While this recovery has injected optimism into the market, analysts caution that the move may represent a “relief rally” rather than a full trend reversal.
A relief rally typically occurs during broader downtrends when markets experience temporary upward momentum due to short covering, renewed buying interest, or macro catalysts. In Bitcoin’s case, data from multiple analytics firms—including CryptoQuant, Glassnode, and TradingView—suggest that market participants are cautiously returning to risk assets.
However, the crypto market remains at a crossroads. According to several analysts, the critical threshold that could determine the next long-term trend lies around $78,000.
For investors searching for new crypto opportunities, yield sources, and practical blockchain use cases, the coming months could define the next phase of the digital asset cycle.
Buyers Return to the Bitcoin Market
One of the most important signals supporting Bitcoin’s recent rebound is the increase in net taker volume in derivatives markets.
Net taker volume measures the imbalance between aggressive buyers and sellers in futures and perpetual swap markets. When the metric is positive, it indicates that buy orders are dominating the market, suggesting stronger demand.
Data from CryptoQuant shows that Bitcoin’s 30-day moving average of net taker volume has remained positive, indicating sustained buying pressure.
According to Coin Bureau CEO Nick Puckrin, the trend began shortly after geopolitical tensions intensified in global markets. Since then, derivatives traders have been increasingly positioning themselves on the long side.
“The 30-day moving average of net taker volume has stayed in positive territory,” Puckrin noted in a recent post. “This shows that buyer aggression is dominating seller activity.”
This resurgence of buying activity has coincided with Bitcoin’s recovery toward $74,000, reinforcing the narrative that institutional and speculative traders are re-entering the market.Image Placement Instruction
Bitcoin Net Taker Volume Trend
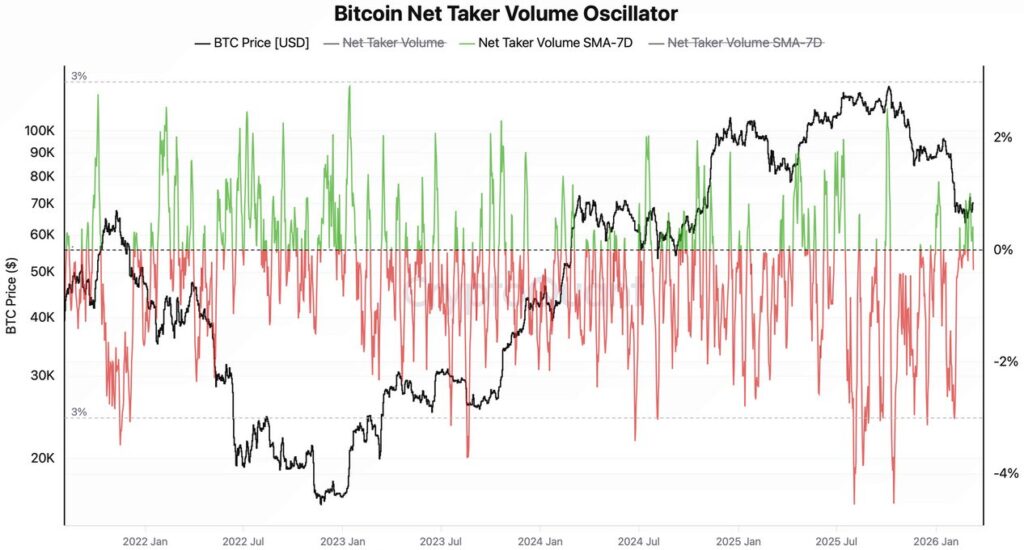
(Image showing net taker volume trend turning positive)
Bull Score Index Signals Improving Market Health
Another indicator supporting the relief rally narrative is the Bitcoin Bull Score Index, which evaluates the market using a combination of on-chain metrics, technical indicators, and macro data.
According to CryptoQuant research head Julio Moreno, the index recently climbed from 10 to 30, marking its highest level since October 2025.
While a reading of 30 still indicates a cautious market environment, it represents a significant shift from the “extreme bearish” phase seen earlier.
Moreno summarized the situation clearly:
“We are still technically in a bearish market, but the current phase can be characterized as a relief rally.”
This shift is important because relief rallies often act as transition phases. They can either fade and lead to further declines—or evolve into the early stages of a new bull cycle.
For crypto investors, the distinction matters enormously. A sustained reversal could reignite altcoin markets, DeFi innovation, and new blockchain business models, while a failed rally might trigger another wave of liquidations.Image Placement Instruction
Bitcoin Bull Score Index Recovery
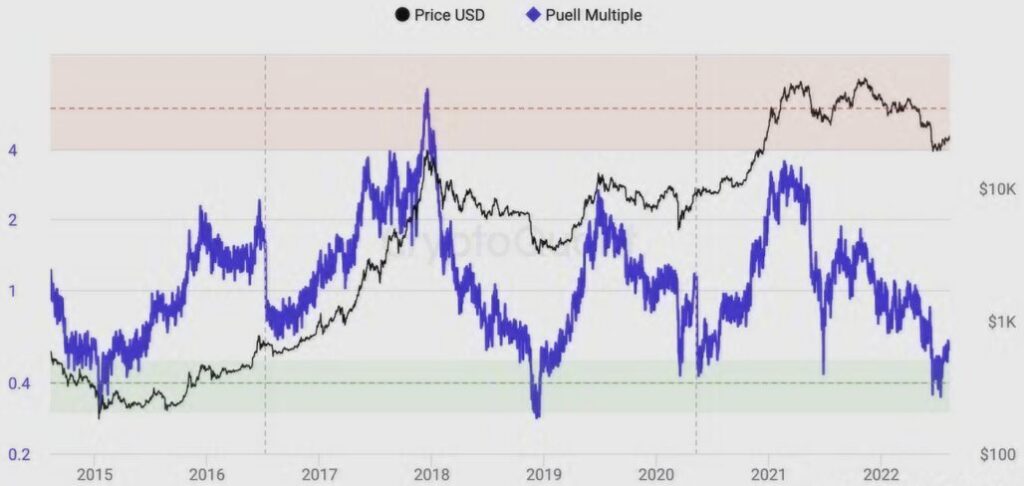
(Image showing Bull Score Index rising from 10 to 30)
Institutional Demand Continues Through Bitcoin ETFs
Institutional participation has also played a major role in stabilizing the market.
Spot Bitcoin ETFs in the United States—launched earlier in the cycle—have continued to attract steady inflows. Recent data shows that these products recorded three consecutive days of inflows totaling approximately $529 million.
This sustained capital flow is significant for several reasons.
First, ETFs provide regulated access to Bitcoin exposure for pension funds, hedge funds, and wealth managers. Second, they represent a structural change in how Bitcoin integrates with traditional finance.
Over the past year, ETF products from major asset managers such as BlackRock, Fidelity, and Ark Invest have transformed Bitcoin from a niche digital asset into a mainstream macro investment vehicle.
In many ways, the ETF era has shifted Bitcoin’s market structure. Instead of relying purely on retail speculation, price movements are increasingly influenced by institutional capital allocation strategies.Image Placement Instruction
Spot Bitcoin ETF Net Inflows
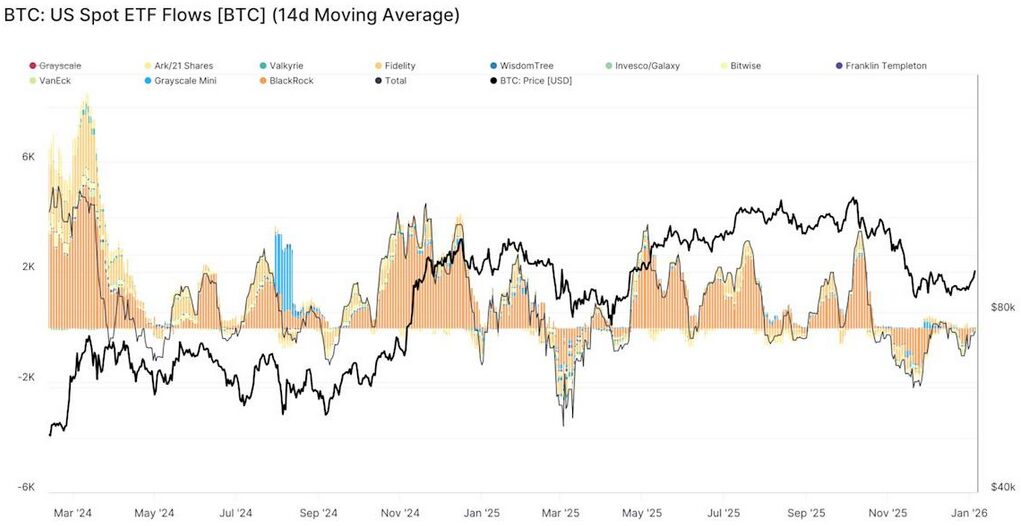
(Image showing cumulative ETF inflows trend)
The $78,000 Barrier: A Critical Technical Level
Despite the recent recovery, Bitcoin remains locked in a wide consolidation range between roughly $62,000 and $72,000.
For more than four weeks, attempts to hold above $70,000 have repeatedly failed.
According to blockchain analytics firm Glassnode, the market is currently trading between two crucial cost basis levels:
- Realized Price: approximately $54,400
- True Market Mean: approximately $78,000
The realized price represents the average acquisition cost of all circulating Bitcoin, while the true market mean reflects the average acquisition cost of actively traded coins.
Historically, these levels have acted as powerful psychological and structural boundaries.
Glassnode analysts note that Bitcoin’s current price behavior resembles patterns observed during 2023’s prolonged consolidation phase.
During that period, the market repeatedly rallied toward the true market mean—only to be rejected.
Eventually, however, a major catalyst arrived.Image Placement Instruction
Bitcoin Price vs Realized Price and True Market Mean
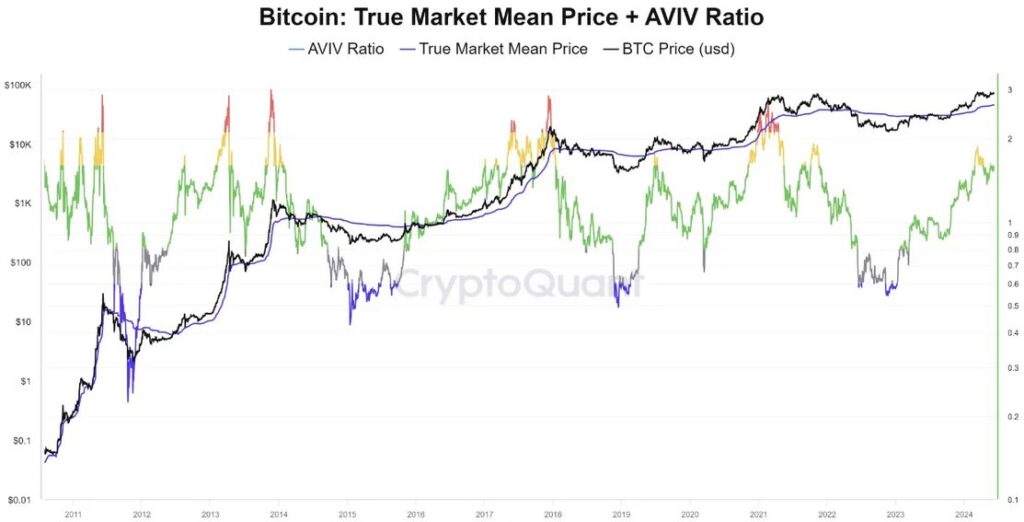
(Image showing BTC price between $54,400 and $78,000)
What Could Trigger the Next Breakout?
In October 2023, Bitcoin finally broke above its cost-basis resistance when anticipation of U.S. spot Bitcoin ETF approvals triggered a massive rally.
Today, analysts are searching for the next macro catalyst capable of producing a similar breakout.
Possible triggers include:
1. Continued Institutional Accumulation
If ETF inflows accelerate again, Bitcoin could gain the momentum needed to break above $78,000.
2. Global Liquidity Expansion
Bitcoin historically performs well when central banks loosen monetary policy and liquidity increases.
3. Geopolitical Instability
Periods of global uncertainty often push investors toward alternative assets.
4. Crypto Market Innovation
New blockchain sectors—such as real-world asset tokenization, decentralized AI, and restaking protocols—could bring fresh capital into the ecosystem.
For investors seeking new crypto revenue streams, these sectors may present opportunities alongside Bitcoin itself.
Key Support Levels Investors Should Watch
While bullish scenarios exist, analysts warn that failure to maintain current levels could lead to renewed downside pressure.
Glassnode notes that if Bitcoin cannot sustain prices above $70,000, the distribution of medium-term returns could shift downward.
Key support levels include:
| Level | Significance |
|---|---|
| $68,300 | 200-week exponential moving average |
| $60,000 – $65,500 | Strong demand zone |
| $58,800 | 200-week simple moving average |
| $54,400 | Realized price (major macro support) |
Historically, the 200-week simple moving average has served as Bitcoin’s final line of defense during major bear markets.
Even during the dramatic collapses of 2018 and 2022, this level ultimately held.Image Placement Instruction
Bitcoin Key Support Levels

(Image showing support zones and moving averages)
The Broader Implications for the Crypto Economy
Bitcoin’s current market structure has broader implications beyond price speculation.
The cryptocurrency industry is entering a phase where institutional finance, blockchain innovation, and macroeconomic forces intersect.
Several emerging trends are worth watching:
Tokenization of Real-World Assets (RWA)
Financial institutions are increasingly exploring blockchain-based representations of traditional assets.
Decentralized Infrastructure
Networks supporting decentralized AI, storage, and compute are attracting venture funding.
Layer-2 Scaling Ecosystems
Bitcoin and Ethereum scaling technologies are expanding practical blockchain use cases.
These developments suggest that the next bull market may not be driven solely by speculation, but also by real economic adoption of blockchain technology.
Conclusion: Bitcoin’s Next Move Could Define the Cycle
Bitcoin’s rebound from sub-$60,000 levels has reignited optimism across the cryptocurrency market.
The return of buyers, improving derivatives metrics, and steady ETF inflows all suggest that market sentiment is stabilizing.
However, the current rally still appears to be a relief rally within a broader consolidation phase.
For a decisive trend reversal, Bitcoin must overcome the $78,000 resistance zone—a level closely tied to the market’s true cost basis.
If that breakout occurs, it could mark the beginning of a new expansion phase for the entire crypto ecosystem, potentially unlocking opportunities across altcoins, decentralized finance, and blockchain infrastructure.
Until then, investors should remain attentive to key technical levels, institutional flows, and macroeconomic catalysts.
The next chapter of Bitcoin’s story may already be unfolding—and the $78,000 threshold could determine whether the market enters its next historic bull run.