Key Points :
- Bitcoin remains above a critical support level despite falling below the 20-day EMA, suggesting strong demand around current prices.
- Ethereum is attempting to reclaim momentum after dipping below its short-term average, with a potential rally toward $2,600 if resistance breaks.
- XRP is showing accumulation pressure below the 20-day EMA, indicating a possible bullish breakout if buyers maintain control.
- Solana remains in a consolidation range between $76 and $95, with the next breakout likely determining the medium-term trend.
- Broader crypto market trends—including institutional inflows, ETF-driven demand, and increasing blockchain utility—may influence the next major rally.
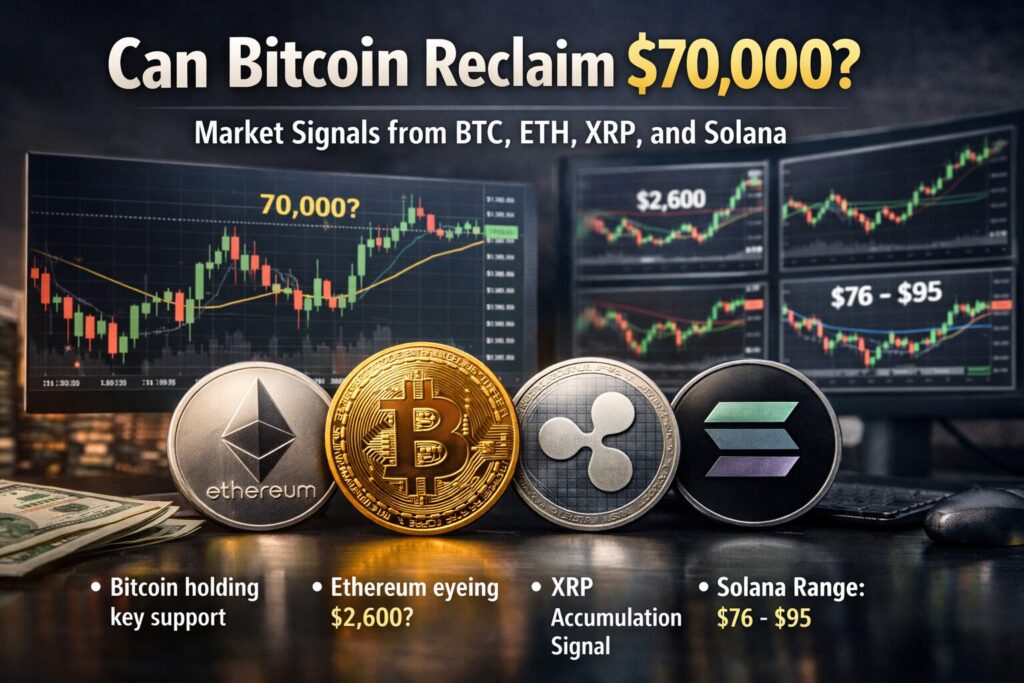
1. Bitcoin’s Critical Test: Can BTC Reclaim the $70,000 Zone?
Bitcoin remains the central indicator of sentiment in the cryptocurrency market. Over the past several trading sessions, BTC briefly dropped below its 20-day Exponential Moving Average (EMA) around $68,553, yet bears failed to push the price below the key support trendline.
This behavior typically signals strong underlying demand. When sellers cannot break through a support zone even after a momentum breakdown, it suggests buyers are accumulating at lower prices.
Market Structure and Support Zones
Currently, the market structure suggests a battle between short-term bearish pressure and long-term bullish accumulation.
The primary levels traders are watching include:
- Support trendline: indicates structural support formed during the recent consolidation phase.
- 20-day EMA (~$68,553): short-term momentum indicator.
- Resistance level (~$74,508): the next major breakout trigger.
- Psychological level (~$84,000): strong potential resistance if the rally continues.
If Bitcoin manages to reclaim the 20-day EMA and hold above it, the probability of breaking the $74,508 resistance level increases significantly. A successful breakout could confirm that the recent correction has formed a short-term bottom.
In such a scenario, BTC could rapidly climb toward $84,000, where stronger selling pressure is expected.
However, the bullish scenario would be invalidated if Bitcoin turns downward and breaks the support trendline. If that happens, the next critical support area lies near $60,000, which historically has attracted significant buying interest.
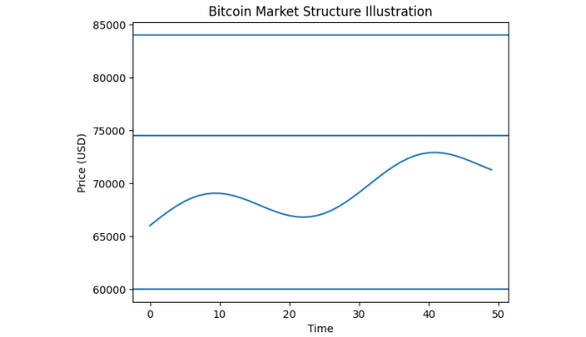
Suggested Graph: Bitcoin price chart highlighting support line, $74,508 resistance, and $84,000 target.
2. Ethereum’s Recovery Attempt: Can ETH Reach $2,600?
Ethereum has mirrored Bitcoin’s recent weakness but shows signs that selling pressure may be fading.
ETH briefly fell below the 20-day EMA around $2,018, yet bears failed to push the price down to the next key support around $1,750. This failure to extend the decline suggests that selling momentum is weakening.
Momentum Indicators
Traders are closely watching whether buyers can push Ethereum back above its short-term average.
If ETH successfully climbs above the 20-day EMA, the next target becomes the 50-day Simple Moving Average (SMA) around $2,249.
A move toward this level would represent a relief rally, where markets rebound temporarily after a decline.
However, the key scenario traders are monitoring is a break above the 50-day SMA. If bulls manage to overcome this resistance, Ethereum could accelerate toward approximately $2,600.
This would mark a significant recovery in market sentiment.
Bearish Scenario
The bullish thesis weakens if ETH fails to reclaim upward momentum.
If Ethereum turns downward around $2,111 and breaks below $1,916, the market may enter a prolonged sideways consolidation range, delaying the next major trend.
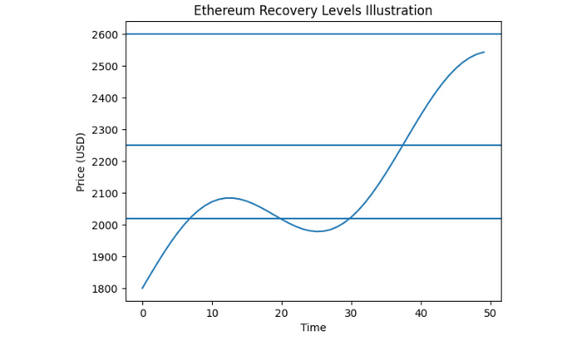
Suggested Graph: ETH price with 20-day EMA, 50-day SMA, and $2,600 breakout zone.
3. XRP Accumulation Signals: Pressure Building Below Resistance
XRP has been trading slightly below its 20-day EMA near $1.39, suggesting persistent buying pressure.
This price behavior often indicates accumulation—a phase where investors gradually build positions before a potential breakout.
Breakout Scenario
If XRP closes above the 20-day EMA, it would represent the first bullish confirmation signal.
Following that breakout, the next target lies near $1.61.
Beyond that, traders are watching the descending channel trendline, which currently defines the broader downtrend.
Breaking and sustaining above that trendline would likely confirm a short-term trend reversal.
Downside Risk
On the other hand, if XRP rejects the 20-day EMA and falls below $1.27, it could indicate that buyers have lost conviction.
In that case, the price could decline toward the next major support zone, where stronger buying interest may appear.
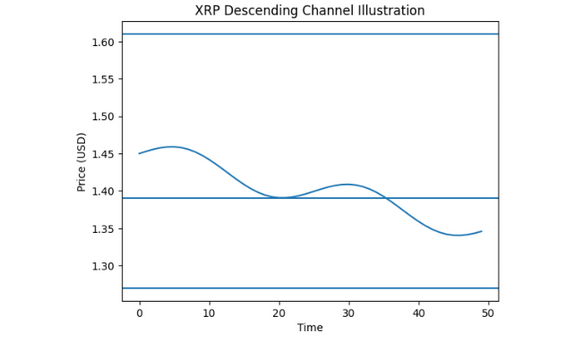
Suggested Graph: XRP descending channel with breakout trendline.
4. Solana’s Consolidation: Waiting for the Next Breakout
Solana has entered a clear consolidation phase, trading between $76 and $95.
This range-bound behavior suggests a temporary equilibrium between buyers and sellers.
Technical indicators confirm this interpretation:
- The 20-day EMA (~$85) is flat.
- The Relative Strength Index (RSI) sits slightly below the midpoint.
Both signals indicate neither bulls nor bears currently hold a decisive advantage.
Potential Breakout Scenarios
The next major trend will likely emerge once the price breaks either boundary of the range.
Bullish breakout scenario
If buyers push SOL above $95, momentum could drive a rally toward approximately $117.
Bearish breakdown scenario
If Solana closes below $76, the bearish pressure may increase, sending the price toward $67, which corresponds to the February low.
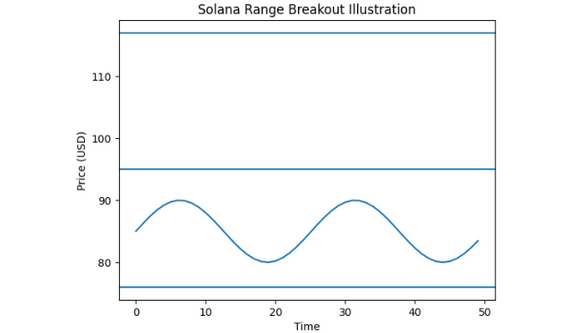
Suggested Graph: Solana consolidation range between $76 and $95.
5. Broader Market Trends Influencing Crypto Prices
While technical indicators provide insight into short-term price movements, macro-level developments are increasingly shaping the cryptocurrency market.
Several key trends are currently influencing investor sentiment.
Institutional Adoption
Institutional demand for digital assets has grown significantly over the past few years.
The launch of spot Bitcoin ETFs in the United States dramatically expanded access for traditional investors.
Large asset managers now view Bitcoin as a portfolio diversification tool, often comparing it to digital gold.
Stablecoin Expansion
Stablecoins are becoming a fundamental layer of global financial infrastructure.
Financial institutions are experimenting with blockchain-based payment systems, enabling faster cross-border transfers and programmable financial services.
Blockchain Infrastructure Growth
New blockchain ecosystems such as Solana, Avalanche, and modular rollups are expanding the range of decentralized applications.
This growth increases demand for native tokens while also improving scalability and transaction throughput.
Tokenized Real-World Assets
Another rapidly growing sector is tokenized real-world assets (RWA).
Assets such as government bonds, real estate, and commodities are increasingly being issued on blockchain networks.
This trend could attract trillions of dollars of traditional capital into the digital asset ecosystem over the coming decade.
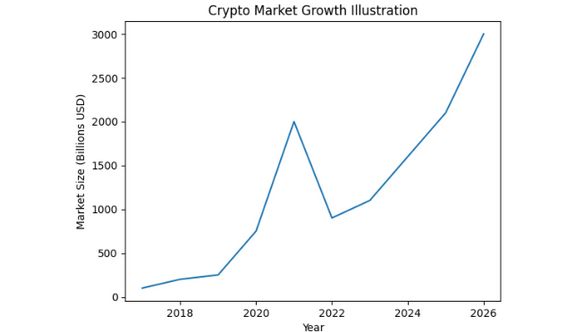
Suggested Graph: Growth of crypto market capitalization vs institutional inflows.
6. What Investors Should Watch Next
Several factors will likely determine the next direction of the cryptocurrency market.
Key indicators include:
- Bitcoin’s ability to reclaim $70,000.
- Ethereum’s attempt to break above $2,249.
- XRP’s potential breakout from its descending channel.
- Solana’s range breakout above $95 or below $76.
- Institutional inflows into Bitcoin ETFs.
If these indicators align positively, the market could enter another bullish expansion phase.
Conclusion
The cryptocurrency market currently sits at a critical technical crossroads.
Bitcoin’s struggle to reclaim the $70,000 level will likely set the tone for the entire market. Ethereum, XRP, and Solana are each displaying technical setups that could trigger substantial price movements in either direction.
Despite short-term uncertainty, the broader structural trends—ranging from institutional adoption to blockchain-based financial infrastructure—remain strongly bullish.
For investors seeking new crypto assets, emerging revenue opportunities, and practical blockchain applications, the coming months could prove decisive.
A breakout above key resistance levels may signal the beginning of the next major market cycle.