
Main Points :
- Bitcoin is approaching a critical weekly close near the 200-week Exponential Moving Average (EMA), which could become a strong resistance level.
- Multiple failed breakout attempts have weakened Bitcoin’s short-term momentum and prevented the price from reclaiming key trendlines.
- Analysts suggest that macro factors such as oil and gold prices may significantly influence Bitcoin’s next directional move.
- Some traders believe Bitcoin could repeat the 2023 price structure, where reclaiming the 200-week EMA triggered a strong rally.
- The $60,000 level is increasingly viewed as a major psychological support zone where institutional buyers may accumulate.
The 200-Week EMA: A Key Technical Line for Bitcoin
Bitcoin is once again approaching a decisive moment as the weekly closing price threatens to confirm a new resistance level around the 200-week Exponential Moving Average (EMA). For many long-term market participants, this technical indicator is one of the most important trend markers in Bitcoin’s entire market cycle.
According to TradingView market data, Bitcoin briefly dropped to around $66,569 during the weekend trading session. This decline placed the cryptocurrency below a critical technical region that traders have been closely monitoring for several weeks.
The 200-week EMA, currently hovering near $68,310, has historically served as a powerful support level during previous market cycles. However, when Bitcoin fails to maintain price action above this line, the indicator can quickly transform into resistance, preventing upward momentum.
Crypto analyst Rekt Capital highlighted the significance of the upcoming weekly close. In a recent social media analysis, he noted that Bitcoin briefly moved above the 200-week EMA during a recent rebound but quickly lost most of the gains. If the weekly candle closes below this indicator, the EMA could solidify as a strong resistance level once again.
Such a development would signal that the market has not yet fully regained bullish momentum.
Bitcoin Price vs 200-Week EMA
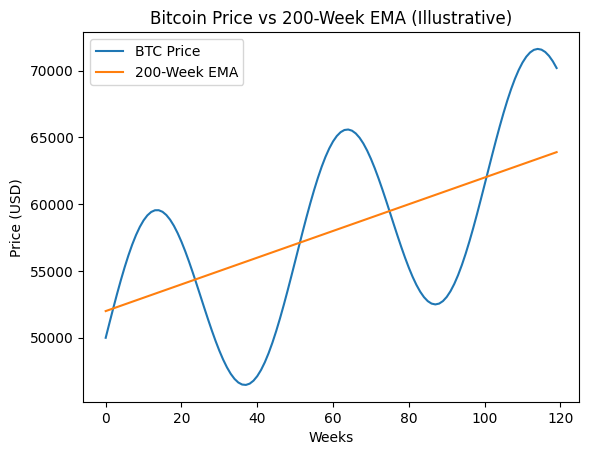
Graph Description:
A weekly BTC/USD chart showing the price approaching and falling below the 200-week EMA line.
Failed Breakouts Signal Market Uncertainty
One of the most concerning aspects of the current market structure is the repeated failure of breakout attempts. Over the past several weeks, Bitcoin has attempted to reclaim key trendlines but has repeatedly been rejected.
This pattern suggests that buyers remain cautious and that market liquidity may not yet be strong enough to sustain a major upward move.
Technical traders often view repeated breakout failures as a sign that the market is entering a consolidation or distribution phase. During this period, prices may move sideways or downward before a new trend begins.
However, history also shows that Bitcoin frequently experiences periods of indecision before large directional moves.
The last time Bitcoin closed a weekly candle below the 200-week EMA was in March 2023, just before the market began a major recovery phase. At that time, the cryptocurrency eventually reclaimed the indicator and rallied dramatically over the following months.
This historical pattern is one reason why some analysts remain cautiously optimistic despite current volatility.
Could Bitcoin Repeat the 2023 Market Structure?
Some traders believe the current market structure resembles the price action seen in early 2023.
Trader Merlijn has argued that Bitcoin could follow a similar trajectory. In 2023, the price briefly fell below the 200-week EMA before reclaiming the level and launching into a powerful rally that reshaped the broader crypto market.
If history repeats itself, the current pullback could represent a temporary liquidity sweep rather than the beginning of a deeper bear market.
In market psychology, such moves are often described as “shakeouts,” where weaker hands exit positions before institutional investors accumulate assets at lower prices.
However, analysts caution that macroeconomic conditions today differ from those of 2023, which means the market may not follow the exact same pattern.
Macro Forces: Oil and Gold May Influence Bitcoin’s Next Move
Beyond technical indicators, macroeconomic forces are increasingly shaping Bitcoin’s price movements.
In particular, traders are closely monitoring oil and gold markets, which have experienced significant volatility due to geopolitical tensions and global economic uncertainty.
Crypto analyst and entrepreneur Michaël van de Poppe recently highlighted the relationship between these assets and Bitcoin. According to him, the performance of commodities such as crude oil and precious metals may determine whether Bitcoin can rebound in the near term.
He noted that traders should closely watch movements in oil, gold, and silver as traditional financial markets reopen.
If these commodities move in a direction favorable to risk assets, Bitcoin could quickly recover and return to higher price levels.
However, if macro conditions remain unstable, Bitcoin may revisit lower support levels.
Bitcoin vs Gold Performance (BTC/XAU Ratio)
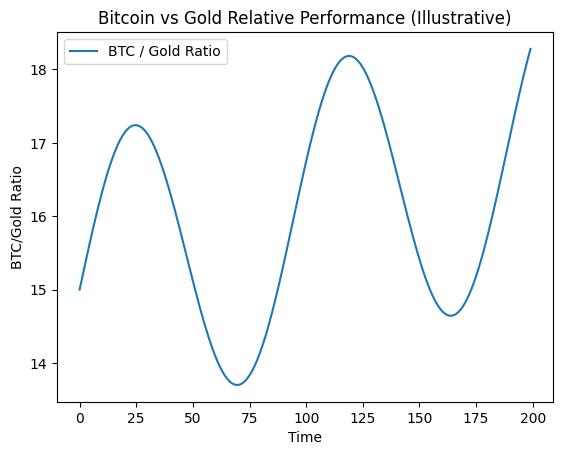
Graph Description:
A chart showing the relative strength of Bitcoin compared to gold, highlighting historically low RSI levels.
Bitcoin vs Gold: Is Bitcoin Undervalued?
One of the most interesting arguments emerging from market analysts is that Bitcoin may currently be undervalued relative to gold.
Van de Poppe pointed out that the Relative Strength Index (RSI) for the BTC-to-gold ratio is near historic lows. This suggests that gold may be overvalued in the short term while Bitcoin appears comparatively cheap.
Historically, periods where Bitcoin underperformed gold often preceded strong BTC rallies.
The logic behind this relationship is rooted in investor behavior. During periods of macroeconomic uncertainty, capital often flows into traditional safe-haven assets such as gold. Once the market stabilizes, investors frequently shift back toward higher-growth assets like Bitcoin.
If this pattern repeats, Bitcoin could experience renewed upward momentum once commodity markets stabilize.
The $60,000 Level: A Critical Psychological Support
While technical indicators provide valuable insights, psychological price levels also play a major role in cryptocurrency markets.
Currently, $60,000 has emerged as a key psychological support level for Bitcoin.
Many traders believe that if the price falls toward this range, institutional buyers and long-term investors may step in aggressively.
Van de Poppe suggested that he would personally consider entering significant buy positions if Bitcoin revisits the $60,000 region, anticipating strong demand from market participants.
Psychological levels such as $60,000 are important because they represent round numbers where liquidity clusters often form.
Large trading orders, algorithmic strategies, and institutional accumulation frequently occur near these levels.
Bitcoin Support and Resistance Zones
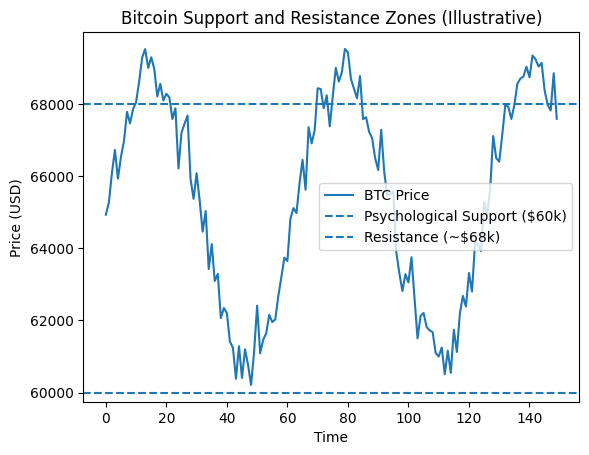
Graph Description:
A BTC price chart highlighting the major support level at $60,000 and resistance near $68,000.
Institutional Adoption Continues to Support Long-Term Bullish Sentiment
Despite short-term volatility, the broader long-term outlook for Bitcoin remains supported by ongoing institutional adoption.
Over the past year, several major financial institutions have increased their exposure to Bitcoin through ETFs, custody solutions, and digital asset investment funds.
The approval of spot Bitcoin ETFs in multiple markets has significantly increased institutional accessibility to the asset.
At the same time, global macroeconomic conditions—including inflation concerns and geopolitical instability—have strengthened Bitcoin’s narrative as a potential hedge against traditional financial risks.
In addition, the growth of the broader blockchain ecosystem continues to reinforce Bitcoin’s position as the dominant store of value within the digital asset industry.
Market Outlook: Consolidation Before the Next Major Move?
Looking ahead, analysts remain divided about Bitcoin’s short-term trajectory.
Some believe the market may experience additional consolidation as traders wait for clearer signals from macroeconomic markets.
Others argue that Bitcoin may be approaching the end of a corrective phase and could soon resume its broader bullish trend.
Much will depend on whether Bitcoin can reclaim key technical levels such as the 200-week EMA and maintain support above major psychological thresholds.
In the coming weeks, traders will be closely monitoring both technical indicators and macroeconomic developments.
Conclusion
Bitcoin currently stands at a critical crossroads. The upcoming weekly close near the 200-week EMA could determine whether the market enters a deeper consolidation phase or prepares for another upward move.
Repeated breakout failures suggest that the market is still searching for direction, while macroeconomic forces—particularly movements in oil and gold—may heavily influence the next trend.
At the same time, historical patterns indicate that Bitcoin has often rebounded strongly after similar technical setups.
With the $60,000 level acting as a key psychological support zone, many investors are preparing for potential buying opportunities should the price decline further.
Ultimately, Bitcoin’s long-term trajectory remains tied to both technological adoption and global macroeconomic conditions. As institutional interest continues to grow and blockchain infrastructure expands, Bitcoin may still be positioning itself for the next phase of its evolving market cycle.