Main Points :
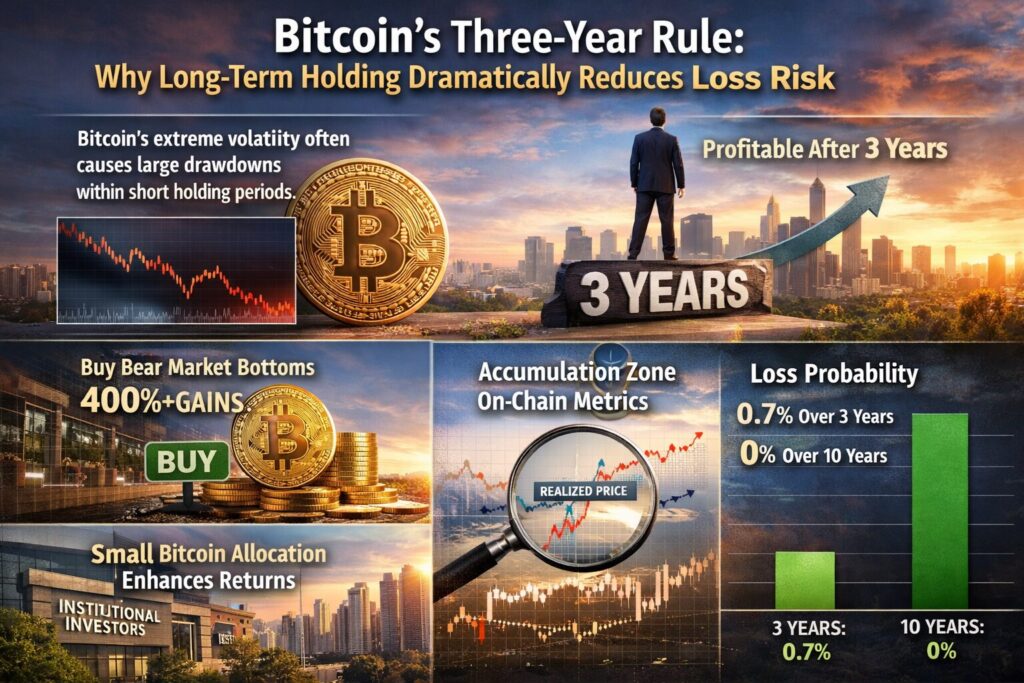
- Bitcoin’s extreme volatility often causes large drawdowns within short holding periods.
- Historical cycle analysis shows that holding Bitcoin for three years dramatically reduces the probability of loss.
- Investors who bought near market peaks often faced losses after two years but turned profitable after three years.
- Buying near bear-market bottoms historically produced returns exceeding 400%–1000% within three years.
- On-chain metrics such as Realized Price and Shifted Realized Price indicate long-term accumulation zones.
- Institutional studies suggest that a small Bitcoin allocation improves portfolio risk-adjusted returns.
- Data from Bitwise shows the probability of losing money falls to 0.7% over a 3-year holding period and 0% over 10 years.
1. Bitcoin’s Reputation for Volatility
Bitcoin has always been one of the most controversial assets in modern finance. Its price has experienced multiple drawdowns exceeding 70%, followed by equally dramatic recoveries. For many investors, this volatility raises an important question: Is Bitcoin too risky to hold?
In the short term, the answer can indeed appear to be yes. Bitcoin frequently experiences double-digit percentage drops within weeks or months. Investors who enter the market during euphoric price peaks often endure painful corrections during the subsequent bear market.
However, a deeper analysis of Bitcoin’s historical cycles reveals a striking pattern. While short-term volatility remains high, the probability of long-term losses decreases dramatically as the holding period increases.
This phenomenon reflects Bitcoin’s unique market structure. Unlike traditional assets such as equities or bonds, Bitcoin operates on a fixed supply schedule, with halving events approximately every four years. These supply shocks, combined with growing adoption, have historically created repeating market cycles characterized by sharp bull markets followed by deep corrections.
For investors willing to adopt a longer time horizon, these cycles may present opportunities rather than risks.
2. The Two-Year vs Three-Year Holding Period
Historical data since 2017 demonstrates a key difference between two-year and three-year investment horizons.
Investors who purchased Bitcoin near the 2017 market peak faced severe losses during the 2018 bear market. Two years after purchasing near the top, many positions were down approximately 48.6%.
However, extending the holding period by just one additional year dramatically changed the outcome. After three years, the same positions showed an average profit of 108.7%.
This pattern repeated in the next cycle. Investors who entered the market near the 2021 peak experienced losses of roughly 43.5% after two years. Yet by the third year, many of these positions had recovered and moved into positive territory with gains of about 14.5%.
These results highlight a crucial principle in Bitcoin investing:
Time in the market often matters more than timing the market.
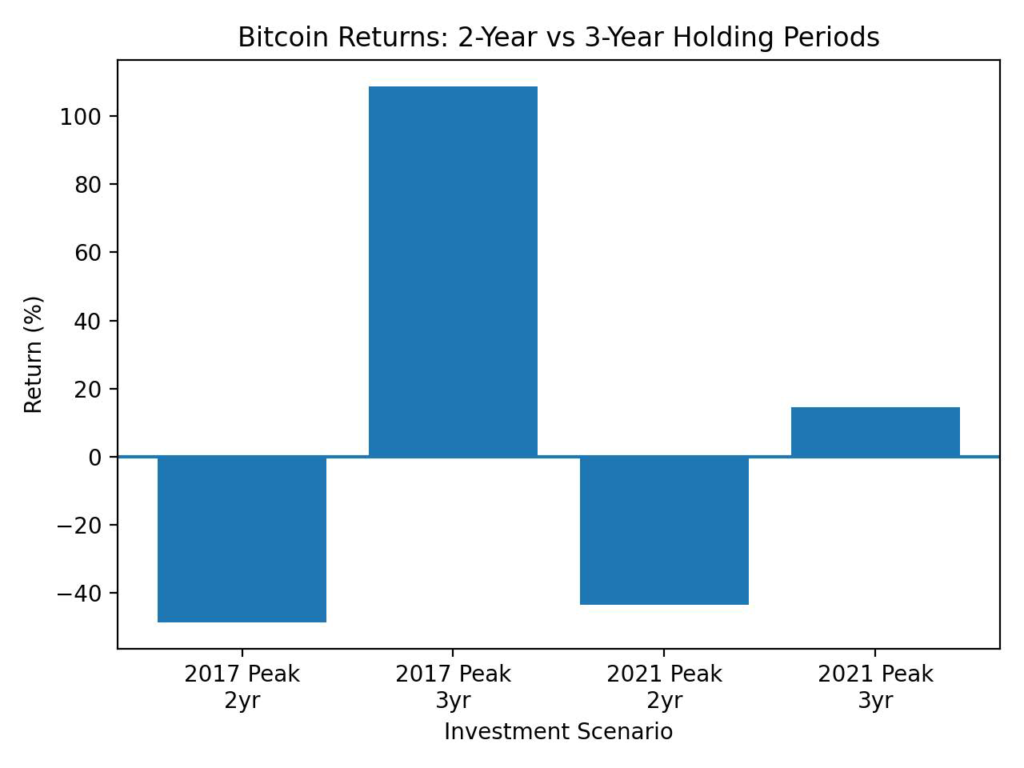
Graph Description:
Comparison of returns between 2-year and 3-year Bitcoin holding periods across market cycles.
3. Buying the Bottom: Extraordinary Returns
While long-term holding reduces loss probability, investors who buy during bear-market bottoms historically achieve even more remarkable results.
For example, investors who accumulated Bitcoin near the 2019 market bottom experienced extraordinary gains.
Within two years, these positions generated approximately 871% returns, and after three years, the returns exceeded 1028%.
A similar trend appeared following the 2022 market bottom. Investors who accumulated Bitcoin during this period achieved returns of roughly 465% after two years and about 429% after three years.
Although these figures vary depending on the exact entry point, they illustrate a broader trend: bear markets have historically provided the most profitable accumulation opportunities.
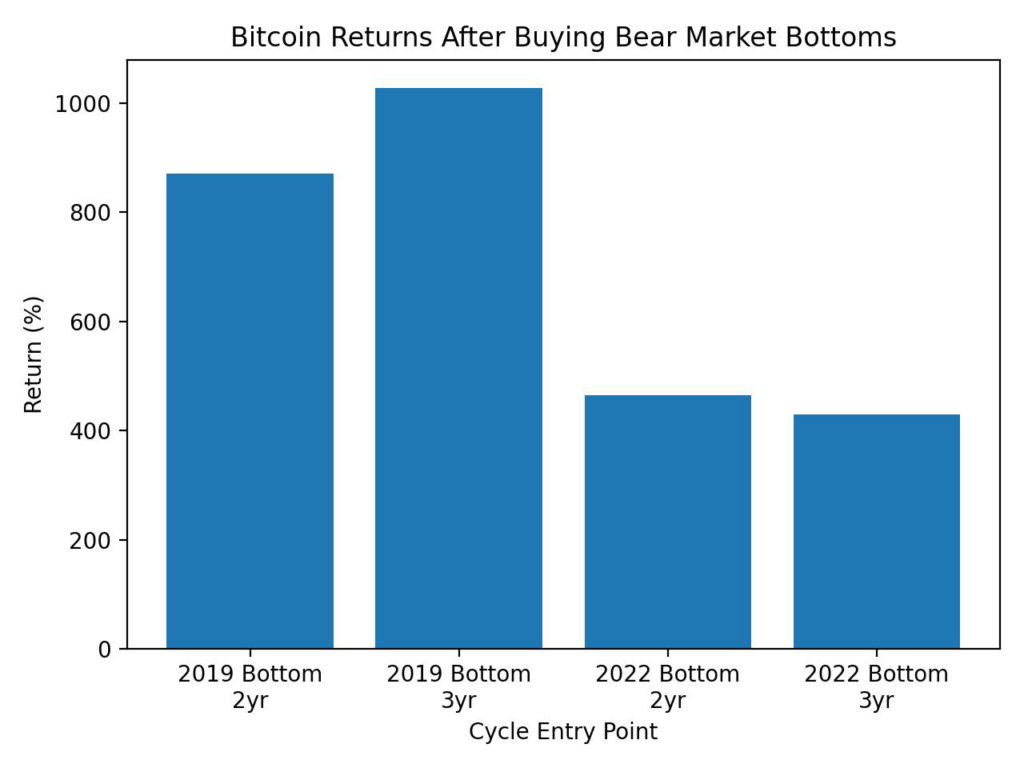
Graph Description:
Returns generated by Bitcoin purchases during market bottoms compared to purchases near cycle peaks.
4. On-Chain Metrics Reveal Accumulation Zones
Modern blockchain analytics provide additional tools to identify potential accumulation zones.
One of the most widely used indicators is Bitcoin’s Realized Price.
Realized Price represents the average price at which all existing Bitcoin last moved on-chain. In other words, it reflects the average cost basis of the market.
During severe market corrections, Bitcoin’s price often falls close to or below this metric. When this happens, it indicates that many investors are holding unrealized losses, historically creating strong accumulation zones.
Another related metric is the Shifted Realized Price, which smooths the data forward to identify long-term valuation bands.
Since 2015, these bands have repeatedly aligned with major cycle bottoms.
As of recent estimates:
- Realized Price: approximately $55,000
- Shifted Realized Price: approximately $42,000
These levels historically mark areas where long-term investors begin accumulating Bitcoin aggressively.
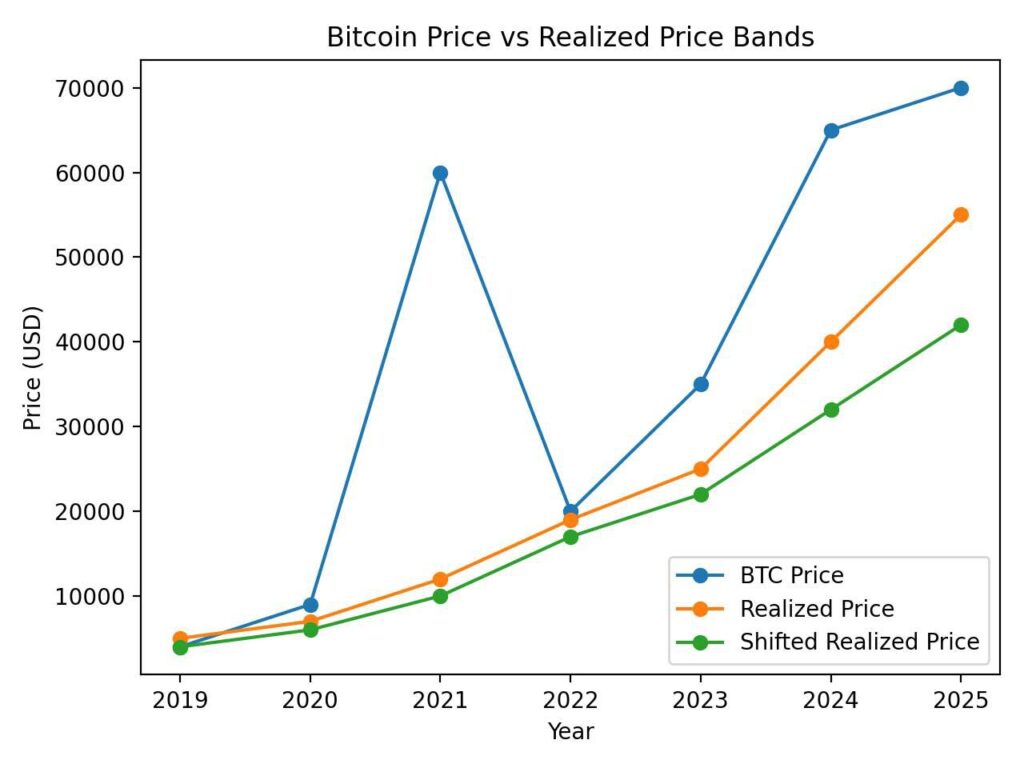
Graph Description:
Bitcoin price compared with Realized Price and Shifted Realized Price accumulation bands.
5. Institutional Research Supports Long-Term Allocation
The importance of long-term holding is not limited to retail investors. Institutional research has reached similar conclusions.
Matt Hougan, Chief Investment Officer at Bitwise, shared research analyzing the impact of adding Bitcoin to a traditional 60/40 portfolio (60% stocks and 40% bonds).
The study found that across every examined three-year period, adding Bitcoin improved both:
- cumulative returns
- risk-adjusted returns
Even a small allocation of approximately 5% Bitcoin produced the most balanced portfolio outcomes.
This finding is particularly important for institutional investors who focus heavily on risk management.
6. The Probability of Loss Over Time
Perhaps the most compelling evidence comes from probability analysis.
Bitwise examined Bitcoin’s historical performance from July 2010 through February 2026 and calculated the probability of loss across different holding periods.
The results were striking.
| Holding Period | Probability of Loss |
|---|---|
| Day trading | 47.1% |
| 1 year | 24.3% |
| 3 years | 0.7% |
| 5 years | 0.2% |
| 10 years | 0% |
These statistics suggest that Bitcoin behaves differently depending on the time horizon.
In short-term trading environments, price movements are largely unpredictable and driven by sentiment, macroeconomic events, and liquidity flows.
However, over longer timeframes, the underlying fundamentals—scarcity, adoption, and network growth—appear to dominate.
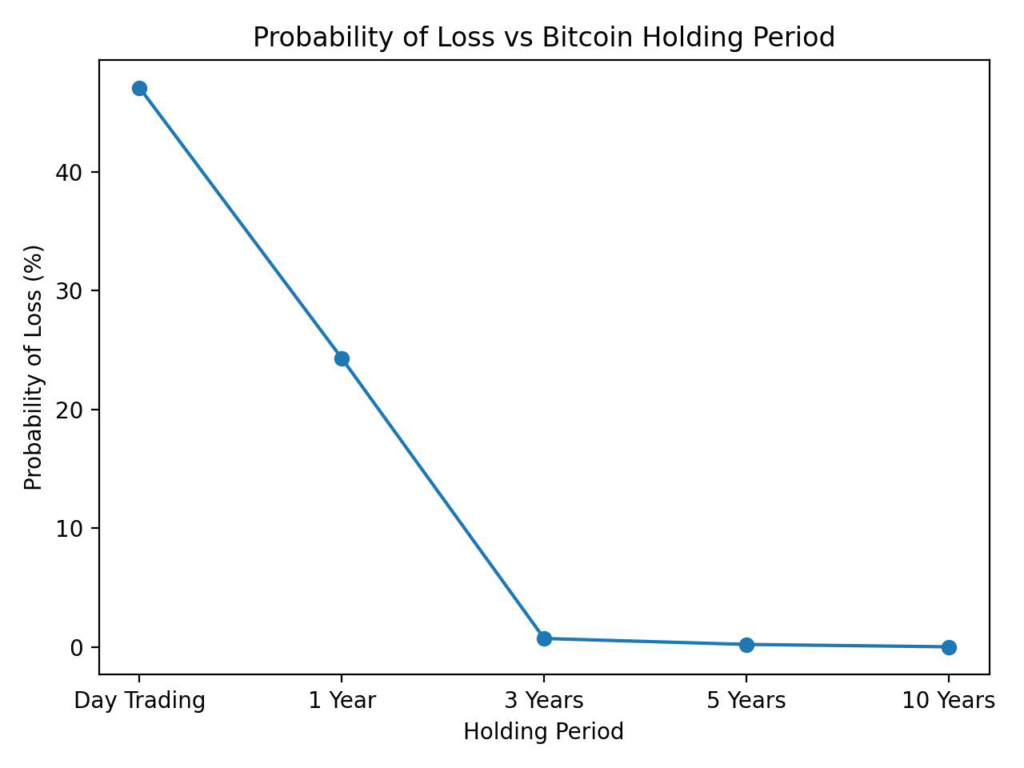
Graph Description:
Probability of loss across different Bitcoin holding periods.
7. Recent Market Trends Strengthening Bitcoin’s Long-Term Case
Beyond historical cycle data, recent developments are further reinforcing Bitcoin’s long-term investment thesis.
Several major trends are shaping the market today:
Institutional Adoption
Spot Bitcoin ETFs launched in the United States in 2024 have attracted billions of dollars in inflows. Large asset managers including BlackRock and Fidelity now offer Bitcoin exposure to institutional investors.
Corporate Treasury Adoption
Companies such as MicroStrategy continue to accumulate Bitcoin as a treasury reserve asset. This strategy treats Bitcoin as a hedge against currency debasement and inflation.
Nation-State Interest
Several governments are exploring Bitcoin either as a strategic reserve asset or as part of digital financial infrastructure.
Integration with Financial Markets
Bitcoin derivatives markets, custody services, and regulated trading platforms have matured significantly over the past decade. This infrastructure has made Bitcoin accessible to pension funds, hedge funds, and asset managers.
Taken together, these developments suggest that Bitcoin is gradually transitioning from a speculative asset into a macro-level financial instrument.
Conclusion
Bitcoin’s extreme volatility has long divided investors. In the short term, dramatic price swings can result in substantial losses, especially for traders who enter the market during euphoric peaks.
However, historical cycle analysis reveals a powerful pattern.
The longer Bitcoin is held, the lower the probability of loss.
Investors who held Bitcoin for only one year faced significant uncertainty. Those who held for two years often experienced large drawdowns.
But once the holding period extended to three years or more, the probability of loss dropped dramatically.
Meanwhile, investors who accumulated Bitcoin during bear-market bottoms historically captured some of the most extraordinary returns seen in modern financial markets.
As institutional adoption accelerates and global financial infrastructure increasingly integrates Bitcoin, the long-term investment thesis continues to strengthen.
For investors seeking exposure to the future of decentralized finance, the data suggests a clear lesson:
Bitcoin rewards patience far more than speculation.


