Main Points :
- Bitcoin briefly surged above $74,000, reaching a one-month high before rapidly losing momentum.
- On-chain data suggests the broader market structure remains bearish, despite the temporary rebound.
- The CryptoQuant Bull Score Index currently sits at 10/100, signaling extreme bearish conditions.
- Short-term optimism has been driven by ETF inflows and improving liquidity, but macroeconomic risks remain.
- U.S. investor demand appears to be returning, as indicated by the Coinbase premium turning positive.
- Analysts suggest that the market may be approaching a momentum transition, though confirmation is still uncertain.
Introduction
The cryptocurrency market is no stranger to sudden rallies and equally swift reversals, and Bitcoin’s recent attempt to reclaim higher price territory illustrates this volatility once again. Earlier this week, Bitcoin briefly surged above $74,000, reaching its highest level in roughly a month. However, the rally quickly lost momentum, and prices retraced sharply to around $71,000, reigniting concerns that the broader market remains trapped in a bearish phase.
While price movements often capture headlines, deeper analysis of blockchain data, macroeconomic conditions, and investor sentiment provides a more nuanced picture. Several crypto analytics firms and market researchers argue that the latest rally may represent a temporary rebound rather than the beginning of a new bull cycle.
At the same time, other indicators—such as renewed buying from U.S. investors and weakening selling pressure from long-term holders—suggest that the market could be approaching an inflection point.
For investors searching for the next opportunity in digital assets, understanding whether Bitcoin is merely experiencing a short-lived bounce or entering a structural recovery is critical. This article explores the latest developments surrounding Bitcoin’s price action, examines the key indicators analysts are watching, and discusses what these signals could mean for the next phase of the crypto market.
Bitcoin’s Rally to $74,000 and Rapid Reversal
Bitcoin’s recent price movement highlights how fragile market sentiment remains in the current environment. On Thursday, Bitcoin briefly climbed above $74,000, reaching a one-month high on major exchanges such as Coinbase. The surge brought the price close to the 50-day exponential moving average, a key technical resistance level closely monitored by traders.
However, the momentum quickly faded.
Within hours, Bitcoin dropped by more than $3,000, falling back below $71,000 by Friday morning. This rapid reversal suggests that buyers lacked the strength needed to sustain a breakout above key technical levels.
The decline also reinforces the idea that short-term rallies may continue to face heavy resistance until broader market conditions improve.Graph insertion location
“Bitcoin Price Movement ($70k–$75k Range)”
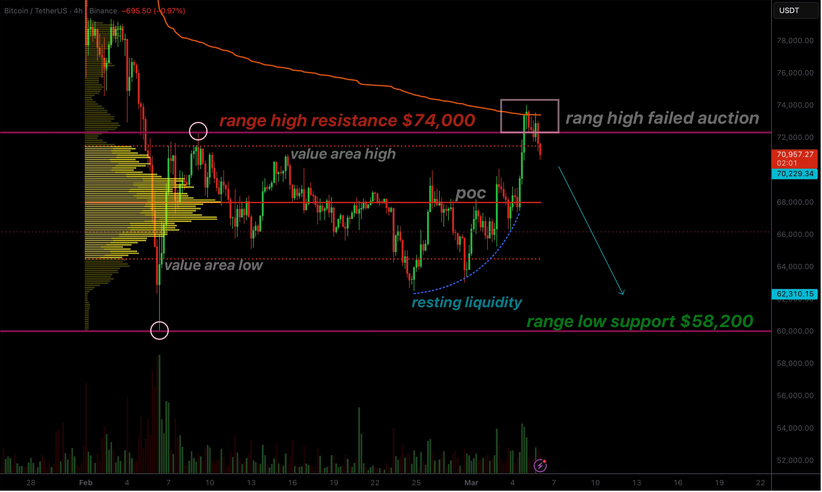
Description: A price chart showing Bitcoin rising to $74,000 and dropping back to $71,000.
On-Chain Indicators Signal Continued Bearish Conditions
One of the most widely cited indicators for assessing Bitcoin’s market health is the Bull Score Index, developed by the on-chain analytics company CryptoQuant. This index combines multiple technical and fundamental metrics to evaluate whether Bitcoin is operating in a bullish or bearish environment.
At present, the index stands at 10 out of 100, placing the market in what analysts describe as an “extreme bearish zone.”
Even though Bitcoin’s price has experienced periodic rebounds, CryptoQuant’s data suggests that underlying fundamentals remain weak. These metrics include:
- Network activity
- Liquidity levels
- Market demand
- Investor profitability
According to the firm, the current rally does not yet display the characteristics typically associated with the beginning of a sustained bull market.
Instead, analysts believe that the recent price increase may simply be a relief rally within a broader bearish trend.Graph insertion location
“Bitcoin Bull Score Index (0–100)”
Description: Indicator showing the current value near 10 in the extreme bearish zone.
Liquidity Improvements and ETF Inflows
Despite the cautious outlook, some short-term drivers have helped push Bitcoin prices upward in recent weeks.
According to analysts at LVRG Research, the recent rebound was partly fueled by a recovery in investor risk appetite and continued inflows into Bitcoin exchange-traded funds (ETFs).
Since the approval of spot Bitcoin ETFs in the United States, institutional investors have gained easier access to Bitcoin exposure. These products have collectively attracted billions of dollars in inflows, which has contributed to increased market liquidity.
When liquidity improves, even modest demand can trigger noticeable price movements. This dynamic appears to have played a role in Bitcoin’s temporary surge above $74,000.
However, analysts caution that these supportive factors may not be strong enough to overcome broader macroeconomic headwinds.
Macroeconomic Risks Still Loom
The global macroeconomic environment remains one of the most significant uncertainties for cryptocurrency markets.
Interest rate expectations, employment data, and overall financial market sentiment continue to influence investor behavior. Analysts note that the expected slowdown in U.S. non-farm payroll growth could introduce additional volatility.
If economic indicators weaken significantly, risk assets—including cryptocurrencies—may face renewed selling pressure.
Historically, Bitcoin has exhibited a strong correlation with liquidity conditions in global markets. During periods of tightening monetary policy or economic uncertainty, capital tends to shift away from speculative assets.
This macro backdrop explains why some analysts remain skeptical that Bitcoin’s recent rally signals a long-term recovery.
Signs of Renewed U.S. Investor Demand
While macro risks remain, there are also encouraging signs emerging from on-chain data.
CryptoQuant highlighted a key metric known as the Coinbase Premium, which measures the price difference between Bitcoin on Coinbase (commonly used by U.S. investors) and global exchanges.
A positive premium typically indicates strong buying pressure from U.S. institutional investors.
Recently, this premium turned positive after spending weeks in negative territory. According to analysts, the metric has reached its highest level since October, suggesting a resurgence of demand among American investors.
This shift may have been a crucial factor supporting Bitcoin’s recent upward movement.Graph insertion location
“Coinbase Premium Trend”
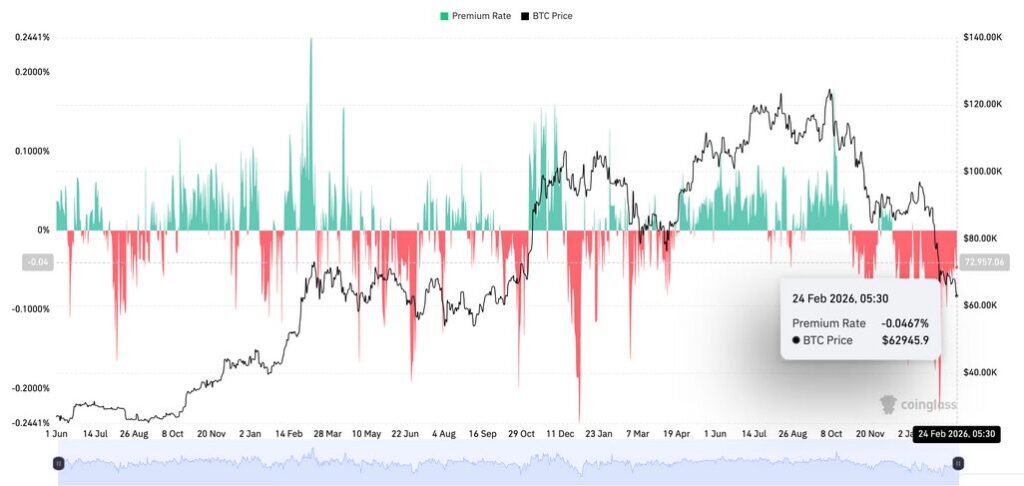
Description: Chart showing the premium moving from negative to positive territory.
Declining Selling Pressure From Traders and Long-Term Holders
Another important development is the apparent reduction in selling pressure across the market.
Recent on-chain data indicates that unrealized losses among Bitcoin holders have expanded to levels not seen since July 2022. When unrealized losses grow significantly, investors often become reluctant to sell at a loss.
As a result, selling pressure tends to diminish.
If fewer coins are entering the market while demand remains stable, price stability or gradual recovery becomes more likely.
This dynamic has historically marked the later stages of bearish cycles.
Momentum May Be Reaching a Turning Point
Some analysts believe that Bitcoin’s momentum indicators could be approaching a critical transition.
Researchers from Swissblock, a blockchain analytics firm, recently suggested that the market may be emerging from its most negative momentum phase.
Momentum shifts often occur before broader market regime changes. In other words, the early signs of recovery may appear in technical indicators long before prices begin a sustained rally.
However, analysts caution that these signals remain preliminary. Confirmation would require stronger demand, improved macro conditions, and sustained price stability above key resistance levels.
Broader Crypto Market Trends
Bitcoin’s current uncertainty reflects a broader theme across the cryptocurrency industry in 2026.
Several structural trends are shaping the market:
Institutional Expansion
Major financial institutions continue to expand their involvement in digital assets, particularly through ETFs, custody services, and tokenized financial products.
Layer-2 and Infrastructure Growth
Blockchain scaling solutions, including Ethereum Layer-2 networks, continue to attract developer activity and investment.
Stablecoin and Payment Adoption
Stablecoins remain one of the fastest-growing sectors in crypto, particularly for cross-border payments and decentralized finance.
For investors seeking new opportunities, these areas may provide significant growth potential even during periods when Bitcoin experiences sideways or bearish price movement.
Diagram insertion location
“Crypto Market Structure in 2026”
Sections:
- Institutional Capital
- DeFi and Stablecoins
- Layer-2 Ecosystems
- Bitcoin as Digital Reserve Asset
What Investors Should Watch Next
For traders and long-term investors, several key indicators may determine Bitcoin’s next major move.
1. ETF inflows and institutional demand
Continued inflows could provide a strong price floor.
2. Macroeconomic liquidity conditions
Interest rate decisions and economic data will remain critical.
3. On-chain demand metrics
Indicators such as exchange inflows and realized profits will reveal investor behavior.
4. Technical resistance levels
The $74,000–$75,000 range remains a key barrier for bullish momentum.
If Bitcoin can sustainably break above these levels, market sentiment could shift dramatically.
Conclusion
Bitcoin’s recent surge above $74,000 briefly reignited optimism in the cryptocurrency market, but the rapid loss of momentum highlights the fragile nature of the current cycle.
On-chain indicators, including CryptoQuant’s Bull Score Index, suggest that the market still exhibits many characteristics of a bearish environment. At the same time, renewed demand from U.S. investors and declining selling pressure hint that the market may be gradually stabilizing.
In the coming months, the interplay between macroeconomic conditions, institutional capital flows, and blockchain-level demand metrics will likely determine Bitcoin’s trajectory.
For investors searching for the next major opportunity in digital assets, the current environment represents both risk and potential. While the bear market narrative remains dominant, the early signals of recovery could be forming beneath the surface.
Understanding these signals—and positioning accordingly—may ultimately determine who benefits most from the next phase of the crypto cycle.