Key Points :
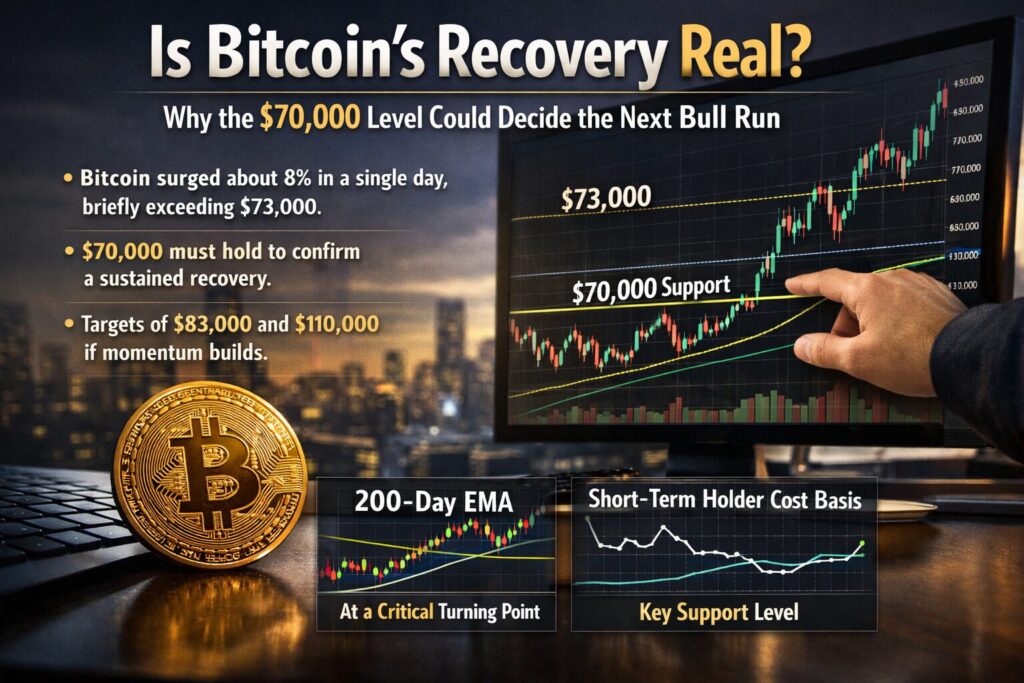
- Bitcoin surged about 8% in a single day, briefly exceeding $73,000, breaking out of a three-week resistance range.
- Analysts say the $70,000 level must hold to confirm a sustained recovery.
- Heavy profit-taking near $69,400–$70,000 has repeatedly stopped rallies.
- If market risk conditions improve, analysts see targets of $83,000 and potentially $110,000.
- Technical indicators such as the 200-day EMA and short-term holder cost basis suggest that the market is entering a critical turning point.
Introduction: A Critical Moment for Bitcoin’s Market Structure
Bitcoin has once again captured the attention of global markets after staging a sharp rebound that pushed prices above $73,000, marking an approximately 8% daily gain. The rally broke through a price range between $64,000 and $70,000 that had confined the market for weeks. Yet despite the apparent strength of the move, analysts warn that the recovery cannot be considered confirmed unless Bitcoin successfully maintains support above $70,000.
This level has become one of the most important psychological and technical thresholds in the current market cycle. Over the past several weeks, every attempt by Bitcoin to reclaim higher ground has encountered intense selling pressure around this price zone. Market data shows that a large portion of investors who purchased Bitcoin earlier in the cycle have been taking profits whenever the asset approaches the $70,000 mark.
The question now dominating conversations among traders, institutional investors, and blockchain entrepreneurs is simple: Is this the beginning of the next major bull run, or merely another temporary rebound within a broader consolidation phase?
To answer that question, analysts are closely examining market liquidity, on-chain data, and macroeconomic trends. These indicators suggest that Bitcoin may be entering a decisive phase where its ability to absorb selling pressure could determine whether the market advances toward new all-time highs or retreats back into a lower trading range.
Profit-Taking Pressure Around $70,000
One of the primary reasons Bitcoin has struggled to break above $70,000 in recent weeks is the sheer volume of profit-taking activity at this level.
On-chain analytics firm Glassnode has identified a pattern where large realized profit spikes consistently occur whenever Bitcoin approaches the $69,400–$70,000 zone. According to their analysis, when the 12-hour simple moving average of realized profit exceeds roughly $5 million per hour, the market tends to stall and reverse.
In practical terms, this means that many investors who bought Bitcoin earlier—particularly during the rally from $50,000 to $60,000—are using this price area as an exit point. The selling pressure has repeatedly overwhelmed buying momentum, preventing the market from establishing a stable foothold above the resistance zone.
Another factor amplifying this behavior is the relatively thin liquidity environment currently present in crypto markets. Compared with the intense liquidity seen during previous bull markets, today’s market structure remains somewhat fragile. When a wave of profit-taking occurs, there may not always be enough buyers immediately available to absorb the selling pressure.
Glassnode describes this situation as a reflection of “fragile demand conditions.” In other words, while demand for Bitcoin still exists, it has not yet reached the level required to sustain a prolonged breakout above resistance levels.
For the recovery to continue, analysts believe the market must demonstrate the ability to absorb these profit-taking events without triggering sharp pullbacks. If buyers consistently step in whenever sellers appear near $70,000, confidence in the rally could rapidly strengthen.
Declining Risk Indicators and the Potential for a Bullish Rally
While profit-taking remains a challenge, other indicators suggest that Bitcoin’s broader market environment may be improving.
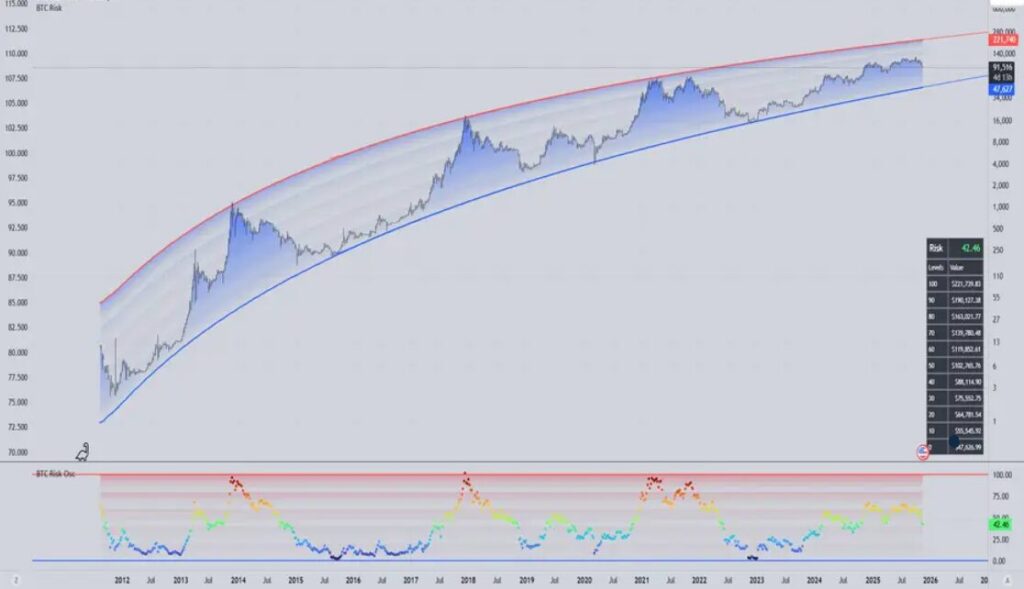
Private asset management firm Swissblock recently noted that Bitcoin’s risk index, which had remained in an “extreme risk” zone for nearly 30 days, is beginning to cool down. This shift could indicate that the market is transitioning out of a high-volatility phase and moving toward a more stable environment.
Lower risk conditions often create the foundation for sustained bullish trends. When volatility decreases and investor sentiment stabilizes, long-term capital—especially institutional capital—tends to re-enter the market.
Swissblock analysts believe that if risk conditions continue to improve, Bitcoin could begin a new upward expansion phase. Their projections suggest that the next major milestones could appear around:
- $83,000 as an initial target
- $110,000 as a potential extended rally level
These targets are not arbitrary numbers. They correspond to historical expansion patterns observed in previous Bitcoin cycles, where periods of consolidation eventually lead to sharp upward movements once key resistance levels are broken.
The Importance of the 200-Day EMA
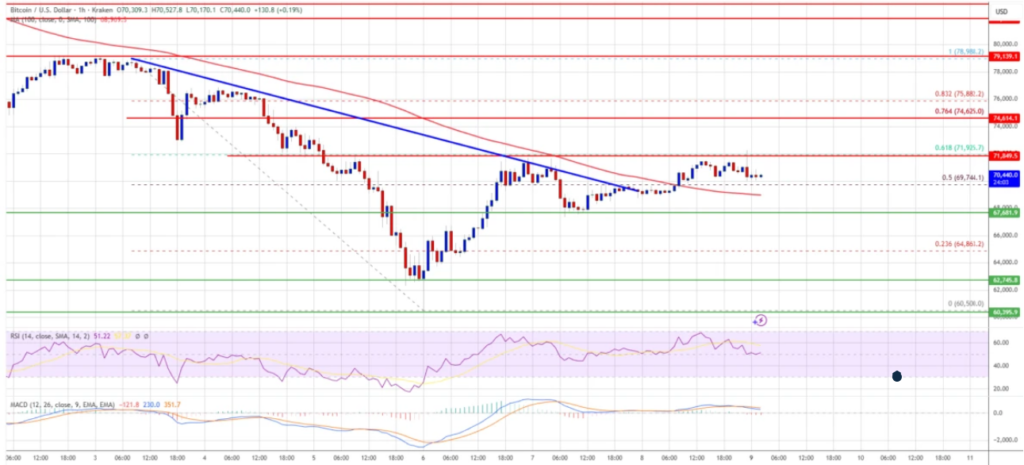
Technical analysts are also focusing on the 200-day exponential moving average (EMA), a widely followed indicator used to determine long-term market trends.
Currently positioned near $68,000, this moving average has become an important support level. Bitcoin recently reclaimed this line after briefly falling below it earlier in the correction phase.
Market analyst Rekt Capital emphasizes that for Bitcoin’s recovery to be considered structurally sound, the asset must convert this EMA from resistance into support on a weekly closing basis. If Bitcoin consistently closes weekly candles above this indicator, it would signal that buyers have regained long-term control of the trend.
However, if the price fails to hold above the EMA, the indicator could once again act as resistance. This would suggest that the market is still in a consolidation or distribution phase rather than a full recovery.
Short-Term Holder Supply: A Hidden Support Zone
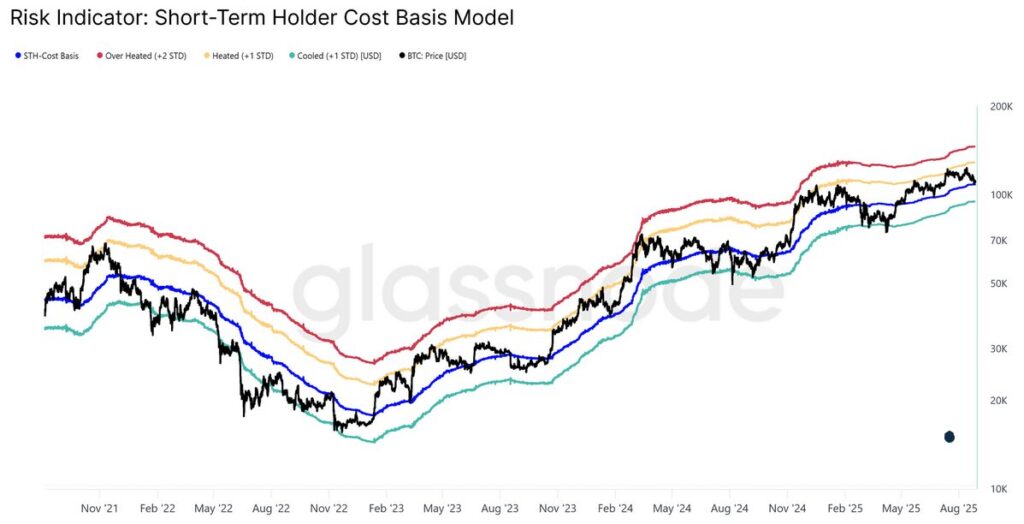
Another critical data point comes from Glassnode’s short-term holder cost basis distribution.
Short-term holders—investors who purchased Bitcoin within the last few months—tend to react more quickly to price movements than long-term holders. Their behavior can therefore provide insight into where major support or resistance levels may emerge.
Glassnode’s heatmap analysis reveals that a significant concentration of Bitcoin supply exists just below the $70,000 level. Over the past month alone, investors accumulated approximately 230,000 BTC within this range.
This cluster represents a powerful psychological and economic support level. Investors who purchased Bitcoin at these prices have a strong incentive to defend their positions. If the market falls below their entry price, they risk entering a loss position.
As a result, many of these holders may choose to buy additional Bitcoin or hold their positions rather than sell, creating buying pressure that supports the market.
Maintaining price levels above this short-term holder cost basis could therefore serve as a key catalyst for a larger breakout.
The Symmetrical Triangle Pattern
From a technical perspective, Bitcoin’s price action has been forming a symmetrical triangle pattern, a structure that often precedes significant breakouts.
This pattern emerges when both resistance and support lines gradually converge, compressing price movements into a narrowing range. Eventually, the market reaches a point where a decisive breakout occurs.
In Bitcoin’s case, the upper boundary of this triangle sits close to $70,000. A confirmed breakout above this level could trigger a new upward trend.
Technical projections suggest that if the breakout occurs and momentum continues, Bitcoin could potentially reach $75,000 by the end of the month.
Institutional Demand and the Broader Crypto Landscape
Beyond technical indicators, broader industry developments are also influencing Bitcoin’s trajectory.
Institutional participation in cryptocurrency markets has grown dramatically over the past two years. Major asset managers, hedge funds, and financial institutions have increasingly integrated Bitcoin into their portfolios.
The approval of spot Bitcoin ETFs in the United States significantly expanded institutional access to the asset. These investment vehicles allow traditional investors to gain exposure to Bitcoin without directly holding the underlying cryptocurrency.
As a result, large inflows of institutional capital have periodically entered the market, helping stabilize prices and strengthen long-term demand.
Additionally, Bitcoin’s role within the broader digital asset ecosystem continues to evolve. Many blockchain projects rely on Bitcoin as a foundational reserve asset or liquidity anchor. In decentralized finance (DeFi), wrapped Bitcoin versions are frequently used as collateral for lending and trading protocols.
This growing integration into financial infrastructure further reinforces Bitcoin’s status as the primary reserve asset of the crypto economy.
Implications for Investors and Blockchain Entrepreneurs
For investors searching for new opportunities in digital assets, Bitcoin’s current price action offers several important lessons.
First, the market is increasingly driven by structural factors such as liquidity, institutional flows, and on-chain data, rather than purely speculative hype.
Second, critical price levels—like the current $70,000 support zone—often determine whether a market continues its upward trajectory or enters a deeper correction.
Finally, the broader cryptocurrency ecosystem continues to expand around Bitcoin. Innovations in decentralized finance, tokenized assets, and blockchain-based payment networks all rely on Bitcoin’s stability and liquidity.
If Bitcoin successfully holds above $70,000, it could signal renewed confidence across the entire digital asset market.
Conclusion: A Decisive Level for the Next Market Phase
Bitcoin stands at a pivotal moment.
The recent surge above $73,000 demonstrates that buyers remain active and capable of driving prices higher. However, the repeated selling pressure near $70,000 shows that the market is still testing its resilience.
If Bitcoin can maintain support above this level and absorb profit-taking flows, the path toward $83,000 and potentially $110,000 could open in the coming months.
Conversely, failure to hold the level may trigger a retest of lower support zones around $65,000–$66,000.
For now, the $70,000 threshold represents far more than just another price level. It is the line that may determine whether Bitcoin’s current recovery evolves into the next major bull market.