
Main Points :
- CryptoQuant suggests Bitcoin’s market bottom may take time to form, projecting a potential low between June and December 2026, with a strong clustering between September and November 2026.
- Historical halving cycles (2012, 2016, 2020) imply bottom formation approximately 777–925 days after the halving event.
- On-chain data indicates cyclical cooling rather than structural collapse.
- Institutional participation and ETF inflows are reshaping the traditional four-year cycle.
- For investors seeking new crypto opportunities, this period could mark the beginning of the next capital rotation phase.
- Practical blockchain applications, infrastructure tokens, and real-world asset (RWA) tokenization may define the next cycle’s winners.
1. Introduction: Reading the Cycle Through On-Chain Data
CryptoQuant, a leading on-chain analytics provider, recently released an analysis suggesting that Bitcoin’s next major market bottom may not arrive quickly. Instead, it may gradually form between June and December 2026, with a particularly high probability cluster between September and November 2026.
Their analysis takes April 19, 2024, the date of the most recent Bitcoin halving, as the starting point. By mapping historical cycle durations onto the current market structure, CryptoQuant projects a potential bottom based on three previous cycle lengths:
- 2012 cycle: 777 days → June 4, 2026
- 2016 cycle: 889 days → September 24, 2026
- 2020 cycle: 925 days → October 30, 2026
When overlaid, these models converge around the September–November 2026 window, forming what they describe as a “sweet spot” for cyclical exhaustion.
This forecast is not a price prediction, but rather a structural time-based projection grounded in historical behavioral patterns and on-chain capital flows.
2. Historical Cycle Mapping: Why Time Matters More Than Price
Bitcoin has historically followed a roughly four-year cycle anchored to halving events. However, what’s often overlooked is that the bottom of the cycle tends to occur 2–2.5 years after the halving, not immediately after a price crash.
Historical Bitcoin Halving Cycles and Bottom Timing
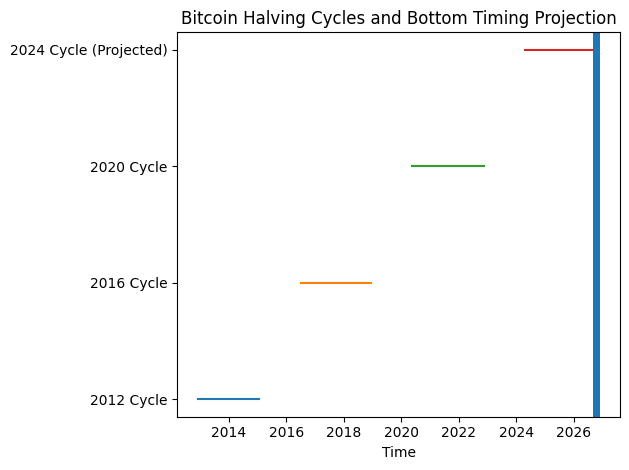
(Visualizing 2012, 2016, 2020 cycles mapped forward to 2024–2026 projection window.)
In previous cycles:
- The 2012 halving was followed by a prolonged consolidation before the 2015 bottom.
- The 2016 halving preceded the 2018–2019 bear market trough.
- The 2020 halving was followed by a correction that found deeper structural exhaustion in 2022.
If the current cycle mirrors those durations, the statistical clustering in late 2026 becomes more compelling.
Time-based models matter because markets are ultimately governed by liquidity cycles, miner economics, and capital rotation dynamics — not just price charts.
3. On-Chain Metrics: Signs of Gradual Cooling, Not Collapse
CryptoQuant’s broader analysis suggests that the current market phase resembles a distribution and digestion phase, rather than systemic failure.
Key indicators often monitored include:
- Long-term holder supply dynamics
- Exchange reserve balances
- Miner capitulation thresholds
- Realized profit/loss ratios
- Stablecoin liquidity inflows
Recent on-chain data shows:
- Long-term holders remain structurally resilient.
- Exchange balances continue trending lower over multi-year horizons.
- ETF-related accumulation has introduced structural bid support absent in earlier cycles.
This implies that even if Bitcoin enters prolonged sideways movement into 2026, it may resemble structural consolidation rather than deep collapse.
4. Institutional Capital: The Wildcard of This Cycle
One major difference between past cycles and today is institutional infrastructure.
Since 2024, U.S.-listed spot Bitcoin ETFs have attracted billions of dollars in inflows. Large asset managers now treat Bitcoin as a macro hedge and portfolio diversifier.
Institutional dynamics alter the traditional cycle in three ways:
- Reduced volatility floors — ETFs absorb selling pressure.
- Slower distribution phases — large capital moves methodically.
- Macro coupling — Bitcoin correlates more with global liquidity and interest rate cycles.
Therefore, while time-based cycle modeling suggests late 2026 as a bottoming window, the depth and structure of that bottom may differ from previous 70–80% drawdowns.
5. What This Means for Investors Seeking the Next Opportunity
For readers searching for:
- New crypto assets
- The next yield opportunities
- Practical blockchain adoption themes
The 2026 bottoming window could represent accumulation territory for the next multi-year expansion.
Historically, capital rotates before Bitcoin fully bottoms. Emerging themes often begin showing strength during late bear phases.
Potential sectors to monitor:
A. Infrastructure & Modular Blockchain Projects
Layer-2 scaling, modular data availability layers, interoperability protocols.
B. Real-World Asset (RWA) Tokenization
Tokenized treasury products, private credit markets, yield-bearing stablecoins.
C. AI + Blockchain Integration
Decentralized compute markets, AI model marketplaces, verifiable data oracles.
D. Payment & Settlement Layers
Faster cross-border systems, stablecoin rails, regulated digital payment gateways.
6. Practical Blockchain Applications Driving the Next Cycle
Unlike earlier cycles dominated by speculation, the next expansion may be driven by revenue-generating blockchain infrastructure.
Key trends:
- Stablecoins exceeding $150B in circulation globally.
- Traditional banks piloting tokenized deposits.
- Cross-border remittance corridors integrating blockchain rails.
- Compliance-first infrastructure emerging in regulated jurisdictions.
Projects that combine:
- Regulatory alignment
- Transparent treasury management
- Sustainable token economics
- Real revenue streams
are more likely to outperform purely narrative-driven tokens.
7. Capital Strategy: Preparing for a Late-2026 Bottom
If September–November 2026 becomes the structural bottom window, capital deployment strategies may include:
- Gradual DCA (Dollar-Cost Averaging) throughout 2026.
- Monitoring on-chain capitulation metrics.
- Watching ETF net inflow trends.
- Tracking miner hash rate stress events.
Hypothetical Capital Deployment Timeline (2024–2027)
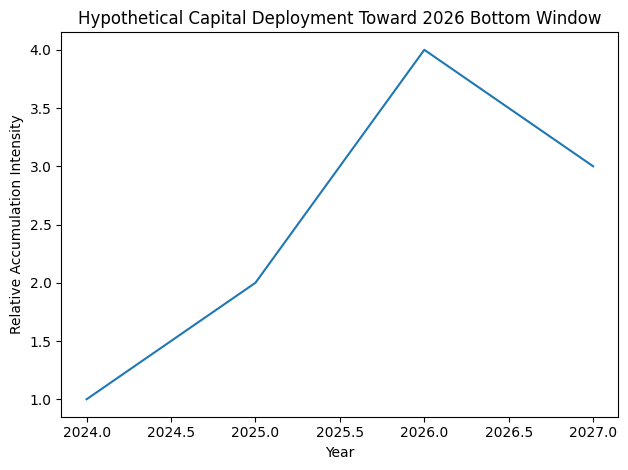
(Showing phased accumulation leading into projected 2026 sweet spot.)
Timing markets perfectly is nearly impossible. However, recognizing structural time clusters allows for probability-weighted allocation planning.
8. Risks to the Model
No cycle projection is guaranteed. Potential invalidation factors:
- Global macro shock.
- Regulatory overreach.
- Major stablecoin failure.
- Accelerated institutional adoption compressing the cycle.
Moreover, as markets mature, historical symmetry may weaken.
9. Conclusion: The Quiet Phase Before the Next Expansion
CryptoQuant’s analysis suggests that Bitcoin’s next major cyclical bottom may likely form between June and December 2026, with September–November 2026 emerging as the most statistically concentrated window based on prior halving-cycle durations.
However, the significance of this projection extends beyond timing. For investors seeking the next growth wave, this period may mark:
- The end of excess leverage.
- The rebalancing of speculative froth.
- The foundation for the next institutional accumulation phase.
Markets rarely bottom in panic alone; they bottom in exhaustion.
If history rhymes, late 2026 may represent the quiet accumulation phase preceding the next structural expansion.
Those preparing early — with research, liquidity planning, and disciplined capital allocation — may be best positioned when the cycle turns.