
Main Points :
- Whale activity is now the dominant source of Bitcoin selling pressure, with exchange whale ratios reaching levels not seen since 2015.
- Altcoin exchange inflows have risen by approximately 22%, historically a precursor to broader crypto market volatility.
- Stablecoin (USDT) net inflows to exchanges have collapsed from $616 million in November 2025 to just $27 million in January 2026, with periods of net outflows.
- European regulatory changes under MiCA have contributed to reduced USDT liquidity in the region.
- Liquidity conditions suggest that large sell orders may not be easily absorbed, increasing the probability of sharp price swings.
- Institutional positioning remains active, but retail participation appears weaker, creating asymmetric liquidity risks.
1. Whale Dominance in Bitcoin Exchange Flows
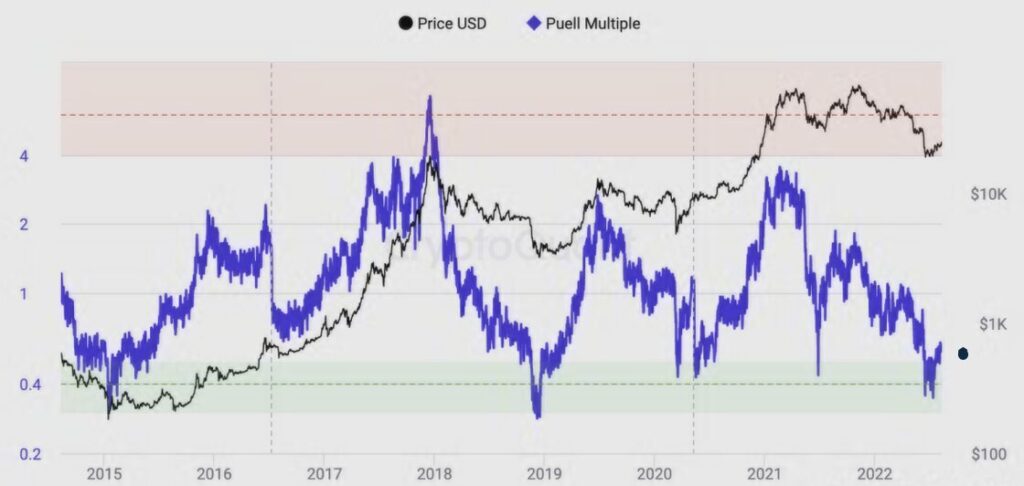
(“Bitcoin Exchange Whale Ratio & Average Deposit Size Trend – 2015–2026”)
According to the latest weekly market report from CryptoQuant, Bitcoin’s current market structure reflects a fragile balance under persistent selling pressure led primarily by large holders—commonly referred to as whales.
Although total Bitcoin inflows to exchanges have normalized compared to peak panic levels, the composition of those inflows has shifted significantly. The exchange whale ratio has climbed to 0.64, the highest level since 2015. This metric indicates that a disproportionately large share of exchange-bound Bitcoin is being sent by large wallets rather than retail participants.
The average Bitcoin deposit size has also reached levels not seen since mid-2022, reinforcing the interpretation that institutional players and high-net-worth holders are actively positioning for distribution rather than accumulation.
This matters because large orders have disproportionate market impact. Even in deep liquidity environments, concentrated whale selling can push order books into thin zones, triggering cascades of liquidations in derivatives markets. When funding rates flip negative and leverage remains elevated, volatility tends to amplify.
In dollar terms, if even 5,000 BTC is transferred to exchanges—as recently reported regarding whale transfers to Binance—that represents roughly $350 million at a $70,000 per BTC valuation. Such size is not trivial in a fragile liquidity regime.
For readers seeking new crypto opportunities, whale-dominated selling environments often create two distinct strategies:
- Defensive positioning with stablecoin yield strategies.
- Opportunistic accumulation during forced liquidations.
However, the sustainability of either depends heavily on liquidity inflows—particularly stablecoins.
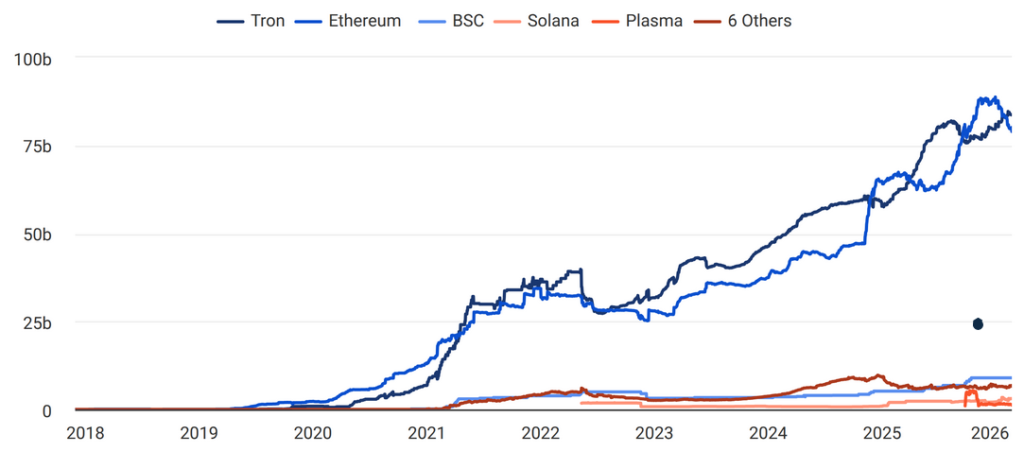
2. Altcoin Inflows and Market-Wide Confidence Erosion
(“Altcoin Exchange Inflows – Q4 2025 vs Q1 2026”)
Altcoins are experiencing renewed pressure. Daily average deposit transactions to exchanges increased from approximately 40,000 in Q4 2025 to nearly 49,000—a 22% rise.
Historically, rising altcoin exchange inflows signal a decline in confidence in non-Bitcoin crypto assets. Investors often move tokens to exchanges either to exit positions or rotate into perceived safer assets.
This pattern tends to precede broader volatility across the crypto market. When altcoin holders sell, they frequently convert into Bitcoin or stablecoins. But in this cycle, both Bitcoin and stablecoin liquidity appear constrained.
Major altcoins like Ethereum, Solana, and high-beta layer-2 tokens have seen weakened order book depth compared to mid-2025 peaks. As volatility rises, market makers widen spreads, further exacerbating slippage for large trades.
For blockchain practitioners, this environment may signal a temporary contraction in speculative capital—but not necessarily in long-term infrastructure growth. In previous cycles, volatility phases often coincided with:
- Increased on-chain activity in decentralized exchanges.
- Growth in perpetual futures hedging strategies.
- Expansion of cross-chain liquidity routing protocols.
Thus, while price pressure exists, practical blockchain usage metrics may remain resilient.
3. The Collapse of Stablecoin Exchange Liquidity
(“USDT Net Exchange Inflows – November 2025 to February 2026”)
Perhaps the most concerning structural shift is the dramatic reduction in stablecoin inflows.
Net USDT inflows to exchanges dropped from $616 million in November 2025 to just $27 million in January 2026. In late January, net outflows of $469 million were recorded.
Stablecoins function as purchasing power within the crypto ecosystem. When inflows rise, they signal incoming buying capacity. When they fall—or reverse—available liquidity to absorb sell pressure diminishes.
This dynamic becomes especially dangerous when whales are actively distributing Bitcoin.
Adding to this pressure is regulatory change in Europe. The implementation of the Markets in Crypto-Assets (MiCA) framework at the end of December 2025 led to restrictions on USDT trading across several major European exchanges. Tether opted not to pursue full compliance under certain provisions, resulting in limited regional support.
While global USDT supply remains substantial, regional liquidity fragmentation can create localized volatility pockets.
Data from CoinGecko and Bloomberg corroborate declining exchange inflows.
For sophisticated investors, this creates three structural implications:
- Thin liquidity amplifies price swings.
- Redemption risk increases during stress events.
- Stablecoin diversification (USDC, DAI, EUR-backed coins) becomes strategically relevant.
4. Institutional Activity vs Retail Retreat
On-chain metrics suggest that institutional activity remains active, but retail engagement appears subdued.
In prior bull phases, retail participation fueled momentum breakouts above key resistance levels such as $70,000. Currently, despite Bitcoin hovering near that psychological threshold, breakout attempts lack volume confirmation.
Exchange derivatives open interest remains elevated but increasingly concentrated among larger players. Retail spot volumes remain comparatively muted.
This imbalance may lead to:
- Short-term squeezes triggered by whale repositioning.
- Sharp downside wicks during liquidity gaps.
- Extended consolidation phases with false breakouts.
For readers searching for new income opportunities, derivatives-neutral strategies—such as basis trading, delta-neutral yield farming, or volatility harvesting—may outperform directional bets in such conditions.
5. Broader Macro and Liquidity Context
Beyond on-chain data, macro conditions continue influencing crypto.
Higher-for-longer interest rate expectations in the U.S., ongoing dollar strength, and tightening global liquidity have suppressed speculative flows across risk assets.
Bitcoin increasingly behaves as a liquidity-sensitive asset rather than a pure inflation hedge. During liquidity contractions, correlations with tech equities tend to rise.
However, structurally, long-term holders (LTH) supply remains historically constrained. This suggests that while short-term volatility may intensify, systemic collapse risk appears limited barring external shocks.
6. Strategic Implications for Crypto Investors and Builders
For investors seeking new crypto assets:
- Monitor whale exchange inflow spikes for capitulation signals.
- Track stablecoin net flows as early indicators of liquidity reversals.
- Focus on tokens with real yield or protocol revenue rather than purely speculative narratives.
For blockchain practitioners:
- Volatility phases are often ideal for infrastructure deployment.
- Cross-border compliance frameworks (e.g., MiCA) create new demand for regulatory-aligned stablecoin solutions.
- Liquidity fragmentation opens opportunities for cross-chain arbitrage and aggregation services.
For treasury managers and digital asset operators, liquidity risk modeling should incorporate:
- Whale concentration metrics.
- Stablecoin redemption velocity.
- Regional regulatory fragmentation.
Conclusion: Volatility Ahead, But Structural Reset Underway
The crypto market currently reflects a fragile liquidity structure characterized by:
- Whale-led selling pressure.
- Altcoin distribution.
- Shrinking stablecoin exchange inflows.
These elements collectively increase the probability of continued volatility in the near term.
However, volatility does not necessarily imply systemic breakdown. Instead, the market may be undergoing a structural reset—transitioning from speculative excess toward a more institutionally dominated and regulation-sensitive phase.
For disciplined investors, such transitions historically present asymmetric opportunity. Liquidity shocks create forced sellers; forced sellers create discounted entries.
The key lies not in predicting exact price levels, but in understanding liquidity flows.
In a market where $350 million whale deposits can shift sentiment and $469 million stablecoin outflows can reduce absorption capacity, the next phase will likely reward those who track capital movement—not just price charts.