
Main Points :
- The overall matrix score is 2.7 out of 5, indicating weak-to-neutral momentum.
- Pattern analysis suggests a descending pennant, increasing the risk of breakdown.
- Ichimoku signals remain bearish with a full three-line reversal.
- MACD shows a golden cross and bullish divergence, hinting at rebound potential.
- RSI is recovering from oversold territory but remains structurally weak.
- Bollinger Bands show a squeeze, signaling an imminent volatility expansion.
- Technical indicators are sharply divided — no decisive trend confirmation yet.
- If breakdown occurs, major support below $61,000 could open a path toward $46,000.
- Reversal confirmation would require reclaiming $73,000–$75,000 zone.
Introduction: The Matrix Method and Why It Matters
In highly volatile crypto markets, single-indicator analysis often leads to bias. The matrix approach evaluates six independent technical frameworks:
- Pattern Analysis
- Moving Averages (9MA & 25MA)
- Ichimoku Cloud
- Bollinger Bands
- MACD
- RSI
Each is rated from 5 (strong) to 1 (weak), and the average defines overall momentum.
The latest matrix score: 2.7
This suggests Bitcoin is neither decisively bullish nor fully bearish — but leaning weak.
For investors seeking new digital asset opportunities or revenue strategies, this is a pivotal moment.
1. Pattern Analysis – Descending Pennant Warning
Bitcoin recently experienced a parabolic selling climax before rebounding. However:
- The rebound failed to reach even the 38.2% Fibonacci retracement.
- The 61.8% pullback of the rebound was quickly breached.
- Current structure resembles a descending pennant, a continuation pattern.
In USD terms, key levels:
- Recent swing low: approx. $63,000
- Breakdown trigger: below $61,000
- Major downside vacuum toward: $46,000
The pattern also raises the probability of a “dead cat bounce” — a temporary rebound before continuation downward.
However, if Bitcoin forms a double bottom near $63,000 and reclaims $70,000, bearish structure weakens.
Score: 1/5
BTC Price & 9MA Illustration
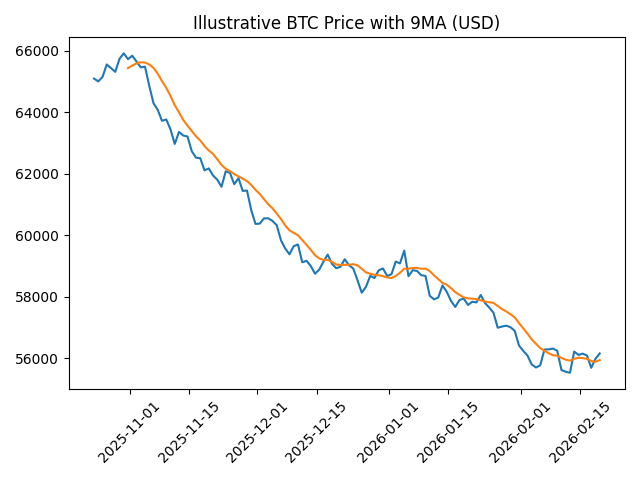
2. Moving Averages – Loss of Short-Term Momentum
The 9-day moving average has flattened.
This indicates:
- Momentum exhaustion
- Transition phase
- Lack of immediate directional bias
Bitcoin is not trending strongly upward nor sharply downward at the moment.
Score: 2/5
3. Ichimoku Cloud – Full Bearish Alignment
The Ichimoku system shows:
- Price below cloud
- Conversion line below base line
- Lagging span below price
This is known as a “three-line bearish reversal.”
Unless price decisively breaks above the cloud (currently around $72,000–$74,000), bearish pressure remains dominant.
Score: 1/5
4. Bollinger Bands – Squeeze Before Expansion
Bollinger Bands have narrowed significantly.
This suggests:
- Volatility compression
- Imminent breakout
- Direction unclear
Squeeze environments often precede large directional moves. Given bearish structure dominance, downside resolution is statistically slightly more probable — but not confirmed.
Score: 3/5 (neutral)
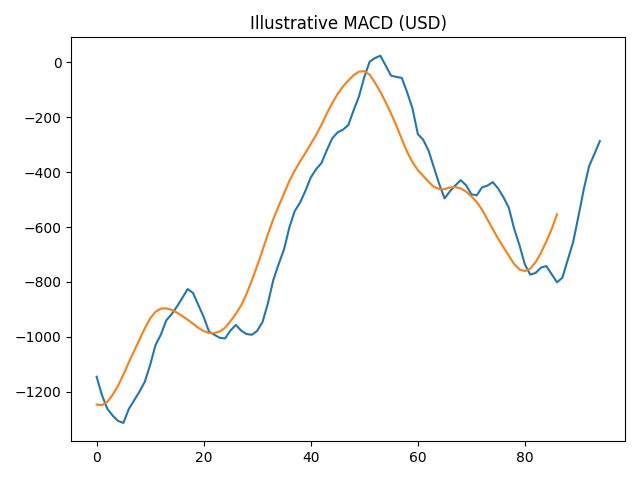
5. MACD – Golden Cross and Bullish Divergence
MACD shows:
- Golden cross
- Possible bullish divergence
This is the strongest bullish element in the matrix.
If price confirms by reclaiming $70,000+, MACD may mark the start of a mid-term reversal.
Score: 5/5
MACD Illustration
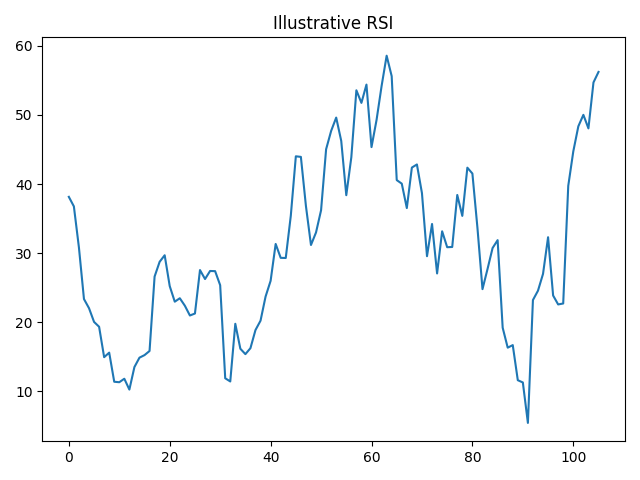
6. RSI – Oversold Recovery
RSI rebounded from oversold levels but remains in the 30–40 range.
This indicates:
- Selling pressure has eased
- But bullish strength is not yet dominant
- Mild divergence may exist
Score: 4/5
RSI Illustration
Macro Context – Why This Matters Now
Beyond technicals:
- Institutional ETF accumulation continues gradually.
- Retail participation remains muted.
- U.S. rate expectations remain uncertain.
- Liquidity conditions are tighter than prior bull cycles.
Bitcoin’s next major move may define Q2 2026 performance.
Scenario Analysis
Bearish Breakdown Scenario
Trigger: Daily close below $61,000
Target zone: $50,000 → $46,000
Catalyst: Macro tightening, ETF outflows
Implication: Opportunity for long-term accumulation at structural support.
Bullish Reversal Scenario
Trigger: Sustained reclaim above $73,000
Target zone: $80,000+
Catalyst: Strong ETF inflows, macro easing
Implication: Altcoins may outperform.
Sideways Consolidation
Range: $61,000–$73,000
Strategy: Range trading, options premium strategies.
Strategic Insight for Blockchain-Oriented Investors
For readers seeking:
- New crypto assets
- Yield strategies
- Practical blockchain applications
Periods of uncertainty often precede major structural opportunity.
Monitoring:
- On-chain accumulation
- Derivatives funding rates
- ETF flows
- Stablecoin supply growth
Will be critical.
Conclusion
The matrix score of 2.7 confirms indecision.
Indicators are sharply divided:
- Structural pattern: bearish
- Momentum oscillators: cautiously bullish
- Volatility: compressed
This is not a confirmed breakdown.
This is not a confirmed rebound.
This is a battleground.
The next decisive weekly move will likely define the macro trend into mid-2026.
Investors should remain disciplined, risk-managed, and prepared for volatility expansion.