Main Points :
- Bitcoin is forming a bearish pennant on the daily chart, suggesting a potential 20% decline toward $56,000 if support breaks.
- A surge in whale inflows to major exchanges signals rising potential sell pressure.
- Despite short-term bearish structure, sentiment indicators suggest a possible medium-term bottom formation.
- Institutional accumulation and ETF flows contrast with retail caution.
- The coming weeks may determine whether Bitcoin transitions into deeper correction or launches a relief rally.
- Volatility creates opportunity for new crypto assets, yield strategies, and practical blockchain use cases.
1. The Bearish Pennant: A Technical Warning Sign
[Bearish Pennant Chart]
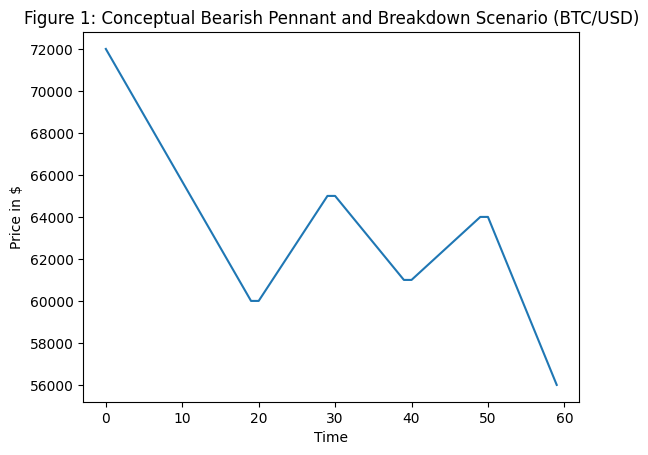
Bitcoin (BTC), currently trading around the low-to-mid $60,000 range, is displaying a textbook bearish pennant formation on the daily chart. This technical pattern typically emerges after a sharp downward move, followed by a period of consolidation within converging trendlines. Historically, such formations tend to resolve in the direction of the initial impulse — in this case, downward.
The structure began forming after a sharp drop from above $70,000 toward $60,000. Since then, price action has tightened into a triangular compression pattern, with lower highs and relatively stable support levels. This compression reflects indecision — but in the context of a prior downtrend, it more often signals continuation.
If Bitcoin decisively breaks below the lower boundary of the pennant, technical projection suggests a move toward approximately $56,000 — representing roughly a 20% decline from recent local highs near $70,000.
Conversely, a breakout above the upper boundary near $72,700 — coinciding with the 20-day Exponential Moving Average (EMA) — would invalidate the bearish scenario and potentially shift momentum back to the upside.
For traders, this is a compression phase before expansion. For long-term investors, this may be the volatility window that precedes strategic accumulation.
2. Whale Inflows: Smart Money Positioning or Pre-Sell Preparation?
[Whale Inflow Ratio Chart]
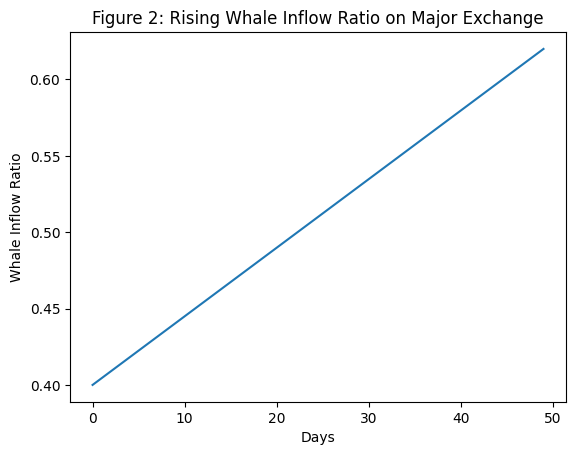
On-chain data from major analytics platforms indicates a sharp rise in the whale inflow ratio on leading exchanges. The whale inflow ratio measures the proportion of total exchange inflows coming from the top 10 large wallet deposits. Recently, this metric climbed from approximately 0.40 earlier in the month to around 0.62 — a significant spike.
Such behavior historically signals one of two possibilities:
- Whales are preparing to sell into liquidity.
- Whales are repositioning collateral for derivatives or hedging activity.
Given the broader technical weakness, many analysts interpret the rise as an increase in potential sell pressure. Large holders moving BTC to exchanges typically precede distribution phases.
However, it is critical to contextualize whale behavior. In modern markets, whales may not necessarily be liquidating spot positions; they may be hedging via futures, engaging in basis trades, or managing ETF-related liquidity demands.
Institutional ETF inflows in recent months have demonstrated consistent accumulation on dips. This creates a structural tension: on-chain whale flows suggest caution, while ETF capital flows imply strategic buying.
For readers seeking new crypto opportunities, whale activity often precedes volatility — and volatility is the raw material of yield generation, whether through options strategies, structured products, or algorithmic market making.
3. Is a Bottom Forming? Sentiment Signals Diverge
[Sentiment Index Chart]
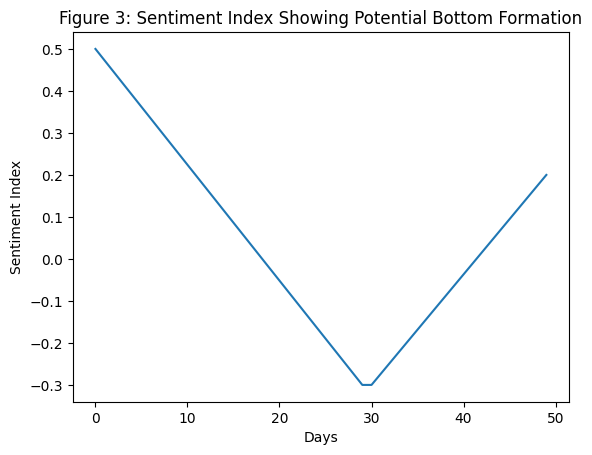
While price structure and whale behavior appear bearish, sentiment indicators tell a more nuanced story.
Recent data from sentiment models shows that the 21-day moving average of Bitcoin’s sentiment index dipped below zero before beginning to turn upward. Historically, this configuration has aligned with medium-term bottom formations.
A sentiment reset typically reflects:
- Retail capitulation
- Deleveraging of overextended positions
- Exhaustion of sellers
Markets bottom not when news improves, but when selling pressure diminishes.
In previous cycles, similar sentiment compressions preceded sustained recovery rallies. That does not eliminate the possibility of a final liquidity sweep lower — markets often “fake out” late buyers — but it increases the probability of a relief rally before any structural collapse.
For investors, this creates a tactical dilemma: wait for confirmation, or accumulate during fear.
4. Macro Environment: Risk Assets Under Pressure
Bitcoin does not operate in isolation. U.S. macroeconomic data, Federal Reserve policy expectations, and global liquidity conditions remain dominant forces.
Rising bond yields have pressured risk assets broadly. Equity markets have shown volatility, and crypto — still classified by many institutional models as a high-beta risk asset — follows.
However, Bitcoin increasingly displays characteristics of digital hard collateral. In regions experiencing currency debasement, capital controls, or geopolitical instability, demand remains structurally strong.
Thus, the short-term macro headwinds coexist with long-term structural tailwinds.
5. Strategic Implications for Crypto Investors and Builders
For readers seeking new crypto assets and revenue streams, the current environment offers multiple pathways:
A. Volatility-Based Yield
Periods of consolidation before breakdown or breakout are ideal for options selling strategies, delta-neutral hedging, and structured yield products.
B. Accumulation Zones
If Bitcoin approaches the $56,000 region, historical on-chain cost basis clusters suggest strong support zones.
C. Infrastructure and Real Utility
Regardless of short-term price, blockchain adoption in payments, settlement, tokenized assets, and cross-border transfers continues expanding. Volatility in BTC does not slow innovation in Layer 2 networks, stablecoins, or institutional custody.
Builders who focus only on price cycles often miss protocol-level growth.
6. The Battle Between Breakdown and Relief Rally
Technically, the bearish pennant projects downside risk toward $56,000.
On-chain, whale inflows warn of distribution risk.
Sentiment, however, suggests seller exhaustion may be approaching.
These conflicting forces create a compression of probabilities.
Markets rarely move in straight lines. It is entirely plausible that Bitcoin experiences:
- A brief breakdown below support,
- A rapid liquidity sweep,
- Followed by a relief rally toward $70,000+.
Alternatively, a decisive break above $72,700 could trap short sellers and ignite upside momentum.
This is a volatility inflection point.
Conclusion: Compression Before Expansion
Bitcoin stands at a technically fragile but strategically important juncture.
The bearish pennant formation warns of potential downside toward $56,000. Whale inflows increase the probability of sell-side volatility. Yet sentiment metrics hint that medium-term bottoming conditions may be forming.
For investors, this is not merely a question of direction. It is a question of positioning.
Periods of uncertainty often provide the most asymmetric opportunities — especially for those exploring structured yield, derivatives, tokenized finance, or emerging blockchain sectors.
Bitcoin’s next move will likely be decisive. Whether breakdown or breakout, expansion follows compression.
And for those prepared, volatility is not risk — it is opportunity.