
Main Points :
- Bitcoin’s rebound is capped near $71,000, with downside risk toward $60,000 if sellers regain control.
- Ethereum struggles below $2,111, with key supports at $1,897 and $1,750.
- XRP attempts to reclaim $1.61 but faces strong breakdown resistance.
- Solana consolidates between $76 and $95, increasing breakout probability.
- Broader macro conditions, ETF flows, and on-chain metrics suggest accumulation beneath surface volatility.
- For investors seeking new revenue streams and blockchain utility, volatility may represent structured opportunity rather than systemic risk.
Market Context: A Rebound Without Conviction
The cryptocurrency market recently attempted a rebound, but momentum quickly stalled. While buyers stepped in at key technical supports, sellers aggressively defended major resistance levels. This behavior reflects a market in transition — not yet decisively bearish, but lacking sufficient strength to confirm a new bullish cycle.
Institutional participation continues through spot ETF inflows, particularly for Bitcoin. However, retail participation remains subdued compared to previous euphoric phases. Derivatives funding rates remain relatively neutral, suggesting leverage is not excessively skewed to one side. In short, the market is coiling — compressing volatility ahead of a larger directional move.
For readers looking for emerging crypto assets, income strategies, and practical blockchain deployment opportunities, such consolidation phases often offer asymmetric setups. The key is identifying structural levels and understanding the probability pathways ahead.
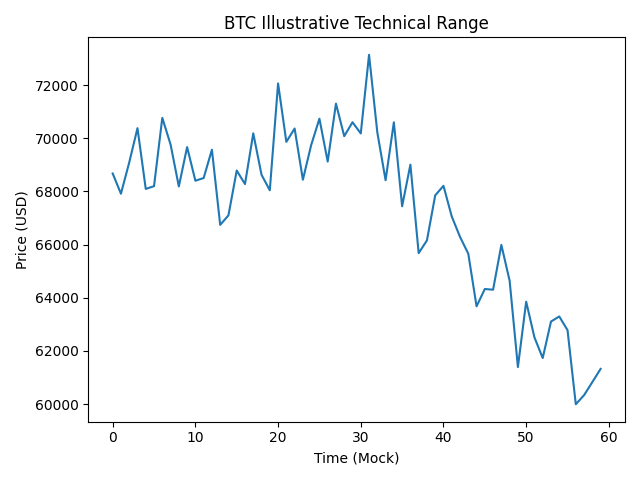
Bitcoin (BTC) Technical Outlook
Key Levels
- Immediate resistance: $71,000
- Breakdown recovery level: $74,508
- Major support: $65,000
- Critical support: $60,000
- Downside extension: $52,500
- 50-day SMA: $83,910
Technical Analysis
Sellers are aggressively defending the $71,000 region, signaling distribution into strength. Each attempt to recover above this level has been met with renewed selling pressure. This suggests that short-term traders are using rebounds as liquidity exits.
For bears to maintain control, price must break below $65,000. If that occurs, the $60,000 level becomes the next critical support. Historically, round-number levels such as $60,000 attract strong liquidity clusters. However, if this support fails on a daily close, downside could extend toward $52,500.
On the bullish side, buyers must reclaim $74,508 to invalidate the breakdown structure. If that occurs, BTC could attempt a move toward the 50-day SMA at $83,910, though strong supply is expected there.
On-chain data from multiple analytics platforms suggests long-term holders are not distributing aggressively. Exchange balances continue gradual declines. This divergence between price stagnation and supply tightening could signal longer-term accumulation.
[Bitcoin Technical Chart]
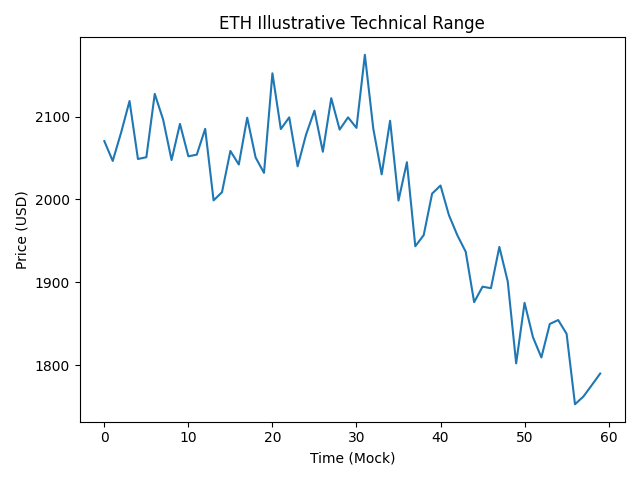
Ethereum (ETH) Technical Outlook
Key Levels
- Resistance: $2,111
- 20-day EMA: $2,221
- 50-day SMA: $2,744
- Immediate support: $1,897
- Strong support: $1,750
- Breakdown extension: $1,537
Technical Analysis
Ethereum continues to struggle below $2,111. Sellers aggressively defend this zone, preventing upside continuation. The market now watches $1,897 as immediate support.
If ETH breaks below $1,897, the next likely test is $1,750. Historically, Ethereum shows strong reactive buying at structurally significant demand zones. However, if $1,750 fails on closing basis, deeper downside toward $1,537 becomes possible.
Conversely, a breakout above the 20-day EMA at $2,221 would signal weakening bearish momentum. That could open a path toward the 50-day SMA at $2,744.
Beyond price action, Ethereum’s fundamental backdrop includes continued L2 adoption, restaking growth, and institutional interest in ETH-based products. Gas fee compression and rollup scaling are improving capital efficiency within the ecosystem. For builders focused on practical blockchain implementation, Ethereum remains the backbone of tokenization, stablecoin issuance, and DeFi protocols.
[Ethereum Technical Chart]
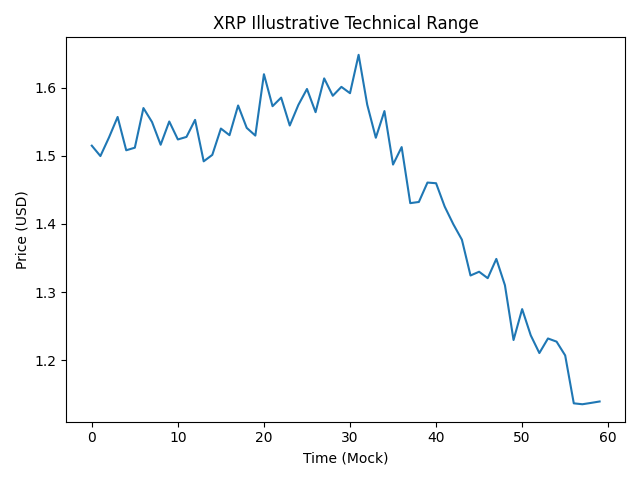
XRP Technical Outlook
Key Levels
- Breakdown level: $1.61
- 20-day EMA: $1.53
- 50-day SMA: $1.81
- Channel support: near $1.20–$1.30
- Major support: $1.11
Technical Analysis
XRP rebounded from its descending channel support and briefly reclaimed the 20-day EMA at $1.53. However, sellers strongly defended the $1.61 breakdown level and pushed price back below short-term averages.
If bulls successfully break above $1.61, XRP could advance toward the 50-day SMA at $1.81. That would likely keep price within the descending channel for an extended period.
If sellers regain dominance and push XRP below channel support, a retest of $1.11 becomes likely.
From a structural standpoint, XRP’s utility narrative centers on cross-border liquidity solutions. Institutional clarity in various jurisdictions has improved sentiment, though price remains technically constrained. For payment-focused blockchain operators, XRP remains relevant in corridors requiring settlement speed and low transaction cost.
[XRP Technical Chart]
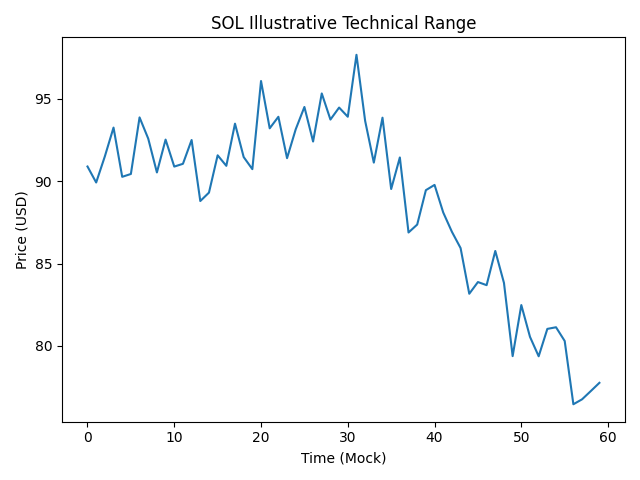
Solana (SOL) Technical Outlook
Key Levels
- Range low: $76
- Breakdown recovery: $95
- Upside target: $117
- February low: $67
Technical Analysis
Solana remains range-bound between $76 and $95. Such consolidations statistically increase breakout probability as volatility compresses.
A breakout above $95 could trigger upside momentum toward $117. Conversely, a breakdown below $76 would invalidate the short-term bullish thesis and expose $67.
Fundamentally, Solana’s ecosystem continues expanding in high-throughput applications, decentralized exchanges, and consumer-oriented Web3 apps. For investors seeking blockchain platforms optimized for scalability, Solana remains a strong contender.
[Solana Technical Chart]
Strategic Implications for Investors and Builders
The current environment is not euphoric, but it is structurally constructive. ETF inflows persist. Stablecoin supply is stabilizing. Layer-2 ecosystems continue expanding. Institutional custody infrastructure is maturing.
For readers searching for:
- New crypto assets
- Yield opportunities
- Practical blockchain use cases
- Strategic treasury allocation models
Periods of range-bound compression historically precede expansion phases.
Rather than reacting emotionally to failed rebounds, sophisticated participants analyze liquidity clusters, volatility compression, and structural accumulation patterns.
Conclusion
The recent rebound across Bitcoin, Ethereum, XRP, and Solana has stalled, but this does not imply structural collapse. Instead, the market appears to be transitioning — compressing volatility before its next decisive move.
Bitcoin must defend $65,000 and reclaim $74,508 for bullish confirmation. Ethereum must hold $1,897 and reclaim $2,221. XRP needs a decisive move above $1.61. Solana’s range suggests breakout potential above $95.
For disciplined investors and blockchain operators, this environment offers strategic positioning opportunities rather than speculative euphoria. Volatility is not the enemy; misinterpretation of volatility is.
The next expansion phase will likely reward those who accumulated during compression, built during uncertainty, and structured risk with precision.