Main Points :
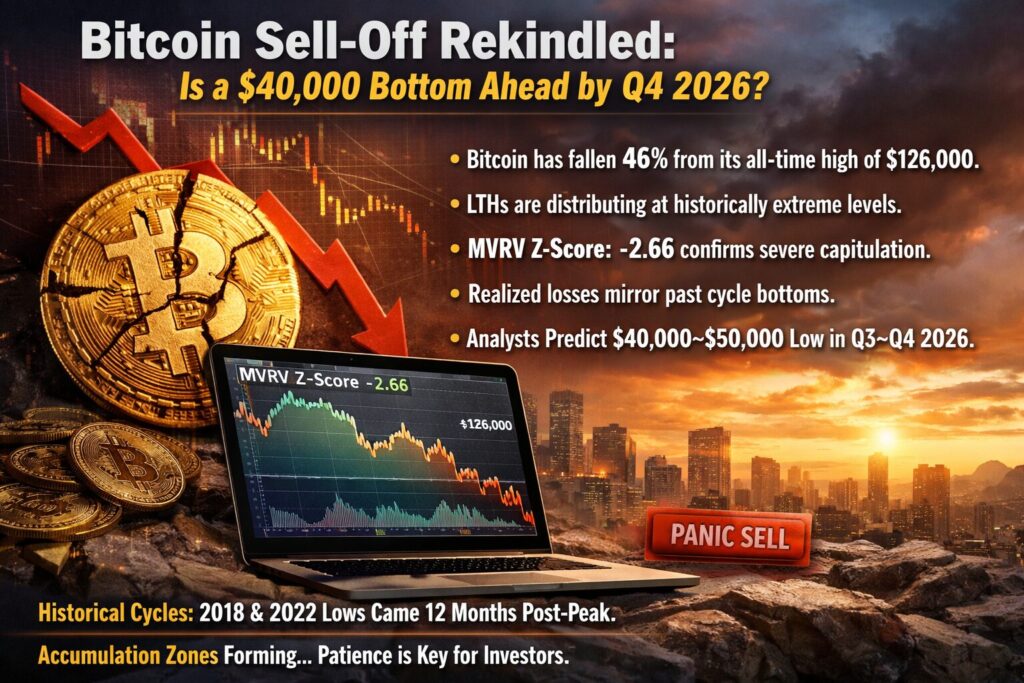
- Bitcoin has fallen 46% from its all-time high of $126,000, reigniting sell-side pressure.
- Long-Term Holders (LTHs) are distributing at historically extreme levels.
- On-chain indicators such as MVRV Z-Score (−2.66) confirm persistent capitulation.
- Realized loss metrics suggest broad market surrender similar to past cycle bottoms.
- Several analysts forecast a potential bottom between $40,000 and $50,000 in Q3–Q4 2026.
- Historical cycle comparisons (2018, 2022) indicate lows often occur 12 months after the peak.
- For investors seeking new crypto opportunities, accumulation zones may be forming—but patience is critical.
1. Renewed Selling Pressure: From $126,000 to a Deep Correction
Bitcoin (BTC) has once again entered a pronounced sell-off phase. After reaching an intraday high of $68,300, the asset reversed sharply, extending a broader correction that has now brought it 46% below its all-time high of $126,000, recorded on October 2, 2025.
This magnitude of correction is not unusual in Bitcoin’s historical cycle structure. Previous bull markets have often been followed by drawdowns of 50% to 80%. However, the psychological weight of a near 50% retracement is significant. Many holders who entered above $70,000 are now sitting on unrealized losses, increasing pressure to reduce exposure.
The current environment resembles prior capitulation stages, where optimism gives way to fatigue, and strong hands test their conviction.
2. Long-Term Holders Are Distributing Aggressively
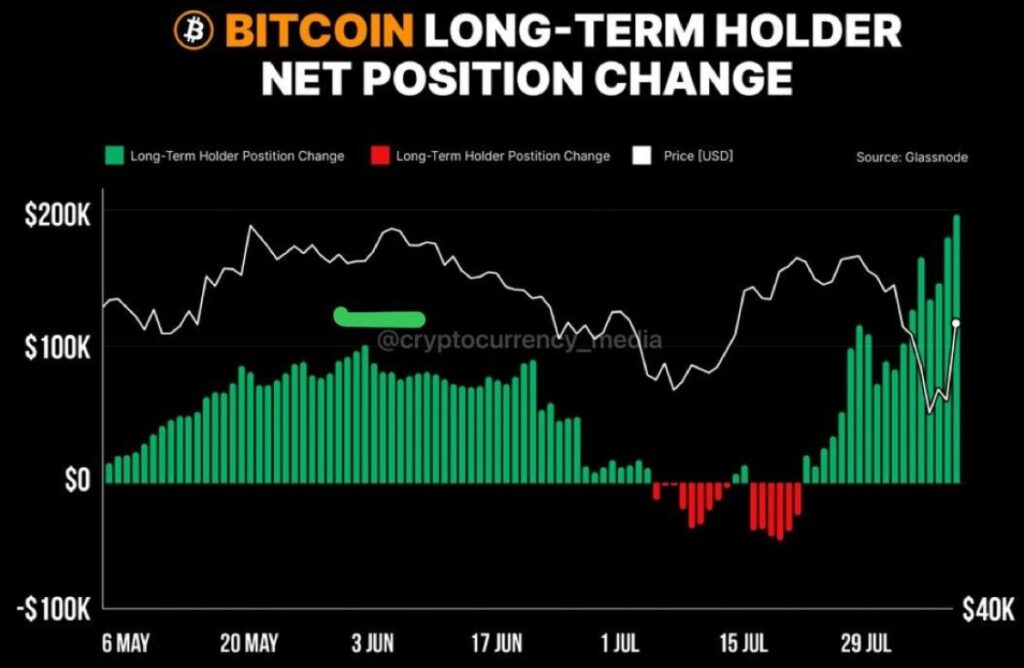
On-chain data from Glassnode reveals that Long-Term Holders (LTHs)—defined as investors holding BTC for more than 30 days in this dataset—reduced their net position by 245,000 BTC on February 6, marking one of the most extreme single-day distribution events of this cycle.
Subsequently, this investor cohort has continued reducing exposure at an average pace of 170,000 BTC per day.
Historically, similar LTH net position shifts occurred during:
- The 2019 correction
- The mid-2021 consolidation phase
Both episodes were followed by extended periods of sideways trading before transitioning into deeper macro declines.
LTH distribution is especially noteworthy because these investors are typically considered “strong hands.” When long-term participants begin selling at scale, it often signals either risk-off macro conditions or cycle exhaustion.
For readers seeking new crypto opportunities, this phase requires careful differentiation between panic-driven exits and structural breakdowns.
3. MVRV Z-Score Signals Persistent Capitulation
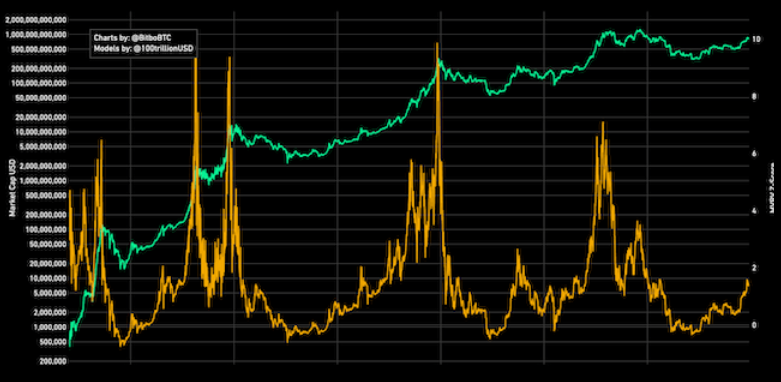
CryptoQuant data shows Bitcoin’s MVRV Z-Score has fallen to −2.66, a level historically associated with deep value zones.
The MVRV Z-Score compares market value to realized value and measures whether BTC is overvalued or undervalued relative to its historical cost basis.
A reading of −2.66 suggests:
- The market price is significantly below aggregate holder cost.
- Selling pressure is driven by capitulation rather than profit-taking.
- Bitcoin is approaching historical accumulation territory.
In prior cycles:
- Z-scores below −2.5 have often preceded multi-quarter accumulation phases.
- However, they do not guarantee immediate reversals.
Capitulation zones can persist for months, as seen in 2014–2015 and 2022.
4. Realized Loss Ratio Nearing Historical Surrender Levels
Glassnode’s realized profit/loss ratio is now approaching below 1, meaning realized losses are overtaking realized gains across the network.
Historically, this condition has aligned with:
- Broad market capitulation
- Weak hands exiting
- Institutional accumulation quietly beginning
Additional data from Checkonchain shows that net realized losses reached $13.6 billion on February 7, marking one of the most extreme readings since the 2022 bear market.
Importantly, during the 2022 cycle, peak realized losses occurred five months before the actual price bottom.
If that historical rhythm holds, a similar timeline could place Bitcoin’s potential bottom around July 2026.
5. Analysts Forecast a $40,000–$50,000 Bottom in 2026
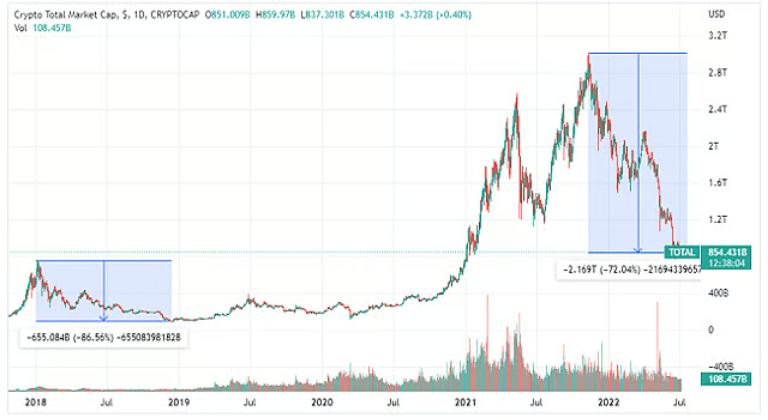
Several market analysts suggest that Bitcoin may extend its downtrend into the second half of 2026.
- Tony Research projects a final capitulation between $40,000 and $50,000, likely forming between mid-September and late November 2026.
- Titan of Crypto notes that in both the 2018 and 2022 bear markets, Bitcoin bottomed approximately 12 months after the cycle peak.
- Given the October 2025 all-time high, that timing aligns with October 2026.
This cyclical symmetry cannot be ignored. Bitcoin has repeatedly followed:
- Parabolic expansion
- Violent correction
- Multi-month consolidation
- Macro bottom roughly 10–14 months post-peak
While cycles evolve, market psychology often rhymes.
6. Macro Context: ETF Flows, Institutional Capital, and Structural Demand
Beyond on-chain data, broader market dynamics must be considered.
Recent developments include:
- Continued institutional ETF participation
- Increased regulatory clarity in major jurisdictions
- Rising integration of Bitcoin in corporate treasury strategies
Unlike 2018, today’s ecosystem includes:
- Spot Bitcoin ETFs
- Regulated custodians
- Institutional derivatives markets
- Sovereign-level policy discussions
This structural evolution may moderate downside volatility compared to prior cycles. However, leverage remains embedded in the system, especially through derivatives markets.
If macroeconomic tightening persists—particularly elevated real interest rates—risk assets could remain under pressure.
7. What This Means for Investors Seeking New Crypto Opportunities
For readers focused on identifying new revenue streams and practical blockchain applications, the current environment presents both risk and opportunity.
Strategic Considerations:
- Accumulation vs. Timing: Deep value indicators suggest accumulation zones may be forming, but patience is essential.
- Capital Allocation Discipline: Avoid deploying full capital in early capitulation.
- Layered Entry Strategy: Historical bear markets reward staggered entries.
- Diversification into Infrastructure: Bear markets often birth the strongest blockchain infrastructure projects.
Historically, some of the most profitable long-term investments were made during periods of maximum pessimism—not during euphoria.
However, bottom prediction precision is less important than strategic positioning.
Conclusion: Capitulation, Cycles, and the Path to Q4 2026
Bitcoin’s renewed sell-off reflects a classic post-peak cycle structure:
- 46% drawdown from $126,000
- Long-term holder distribution
- MVRV Z-score in deep negative territory
- Realized losses approaching surrender extremes
Multiple analysts converge on a potential bottom in the $40,000–$50,000 range, likely between Q3 and Q4 2026.
Yet history teaches that:
- Capitulation phases are uncomfortable.
- Bottoms form when conviction is weakest.
- Structural adoption continues even during price decline.
For forward-looking investors, this period may represent a preparation phase rather than a panic phase.
The question is not simply whether Bitcoin will reach $40,000.
The deeper question is:
Will the next accumulation cycle begin quietly while most participants remain focused on short-term fear?
If historical patterns hold, the answer may unfold in the final quarter of 2026.