Main Points :
- Recent price action across major cryptocurrencies suggests a possible bottoming process, but confirmation remains incomplete.
- Bitcoin is struggling below key resistance, indicating sellers still control the short-term trend.
- Ethereum shows relative resilience, hinting at selective accumulation rather than panic selling.
- XRP remains structurally weak unless it breaks above its short-term moving average.
- Solana reflects high volatility typical of high-beta assets, offering both risk and asymmetric opportunity.
- For investors and builders, this phase favors strategic positioning, yield-focused strategies, and real-use blockchain applications rather than pure momentum trades.
Market Context: Why “Bottom Formation” Matters Now
After months of heightened volatility and macro-driven uncertainty, crypto markets are once again facing the same critical question that defines every cycle: has the bottom already been formed, or is further downside still ahead?
This question is not academic. For investors seeking new digital assets, for operators designing yield strategies, and for teams building real-world blockchain applications, identifying bottoming phases is essential. Historically, these periods are when capital-efficient accumulation, infrastructure building, and product-market fit experimentation quietly begin—long before optimism returns to headlines.
The following analysis is based on recent chart structures and is supplemented with broader market observations from derivatives data, on-chain behavior, and recent institutional trends.
Bitcoin (BTC): Sellers Still Defend the Line
Technical Overview
Bitcoin’s rebound stalled just below $74,508, a level that previously acted as support and has now flipped into resistance. This behavior strongly suggests that bearish participants are actively defending this zone.
Bitcoin daily chart with 20-day EMA, 50-day SMA, and RSI
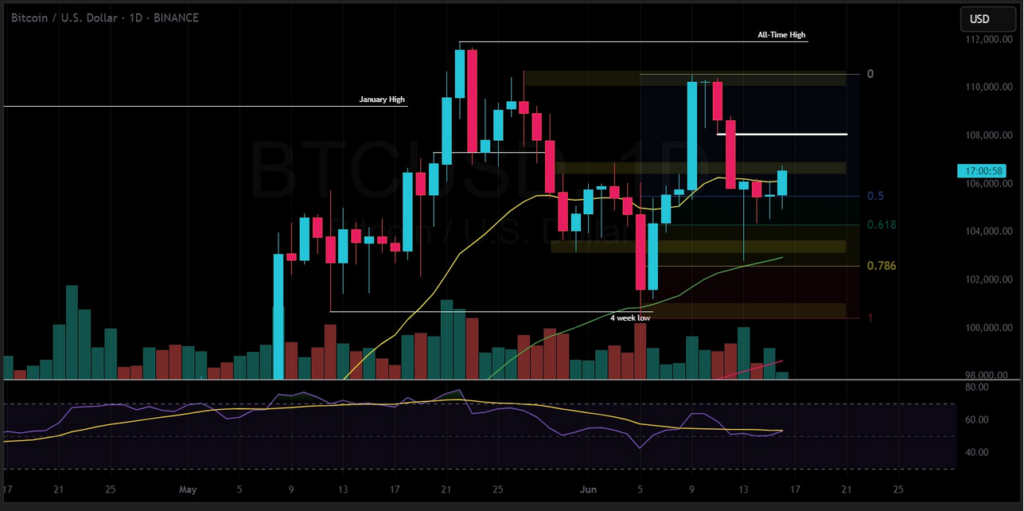
The 20-day exponential moving average (EMA) at $78,142 is sloping downward, while the Relative Strength Index (RSI) remains in negative territory. Together, these indicators confirm that sellers currently maintain tactical control.
Scenarios to Watch
If BTC is rejected again near $74,508 or the 20-day EMA, bears may attempt to push price toward the $60,000 region, which represents both psychological support and a prior consolidation area.
Conversely, a decisive close above the 20-day EMA would invalidate the immediate bearish thesis. Such a move would signal strong dip-buying interest and open the path toward the 50-day simple moving average (SMA) near $86,636.
Practical Implications
For investors, Bitcoin currently functions more as a risk barometer than a high-return opportunity. For builders, however, Bitcoin’s stability—even during drawdowns—continues to support use cases in treasury management, settlement rails, and asset-backed tokenization.
Ethereum (ETH): Quiet Strength Beneath the Surface
Technical Overview
Ethereum’s recovery has met selling pressure near $2,111, but importantly, bulls have not fully ceded control. This contrasts with prior sell-offs where ETH underperformed sharply.
Ethereum daily chart highlighting $2,111 resistance
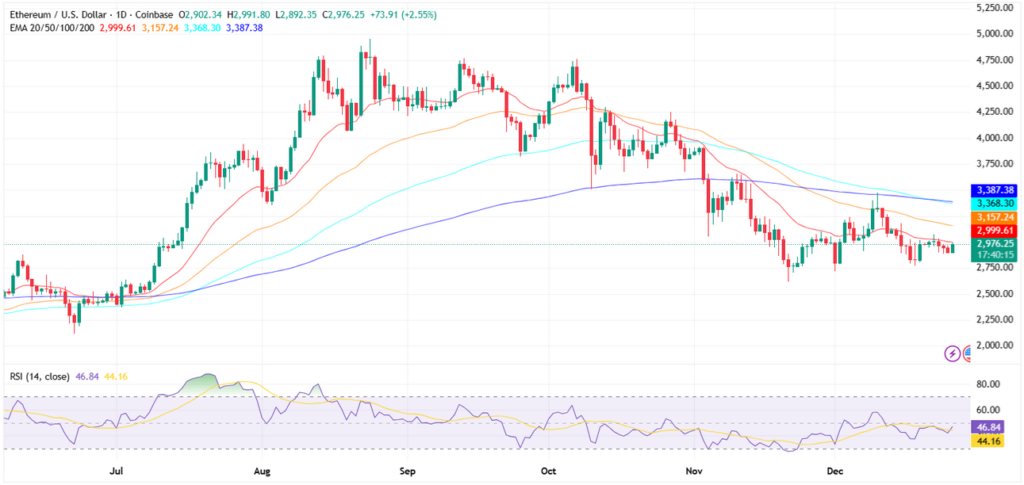
If ETH closes convincingly above $2,111, the next upside target becomes the 20-day EMA at $2,447. This level is critical: breaking it would suggest that bearish momentum is fading. A further advance could carry ETH toward the 50-day SMA at $2,877.
Downside Risk
For bears to retain dominance, they must aggressively defend the $2,111 area. Failure to do so could expose ETH to renewed selling toward $1,750, and in a more severe scenario, $1,537.
Practical Implications
Ethereum remains the backbone of DeFi, token issuance, stablecoin infrastructure, and smart-contract settlement. Even during price weakness, network usage and developer activity remain comparatively strong—making ETH particularly relevant for readers seeking practical blockchain deployment opportunities, not just price appreciation.
XRP: Structure Matters More Than Headlines
Technical Overview
XRP is currently holding above the support line of a descending channel, but buyers are struggling to push price above the 20-day EMA at $1.63.
XRP descending channel pattern
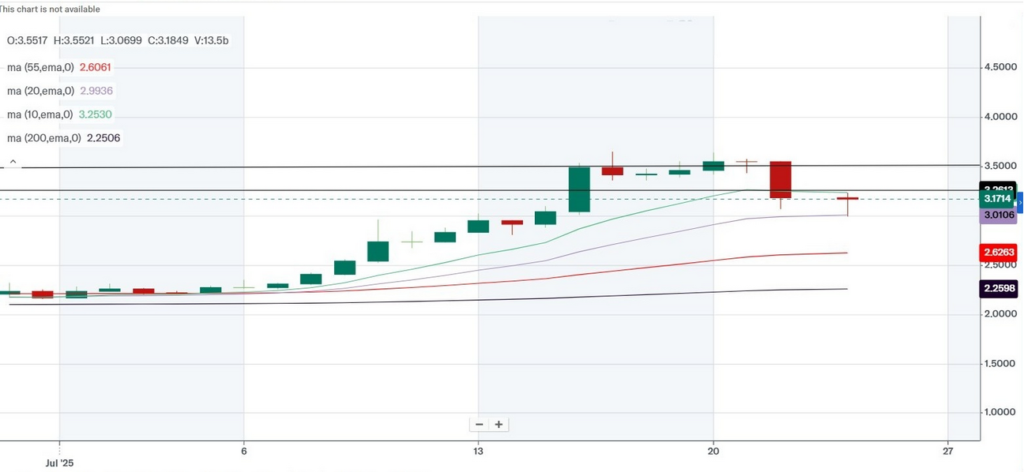
A breakdown below channel support would reinforce bearish dominance, potentially leading to a retest of $1.11. If that level fails, psychological support near $1.00, and even $0.75, comes into focus.
Bullish Reversal Conditions
To regain short-term control, buyers must push XRP above the 20-day EMA. A close above the descending trendline would strongly suggest the beginning of a new bullish phase.
Practical Implications
XRP’s relevance increasingly lies in cross-border settlement experiments and regulatory-aligned blockchain use cases. Price action alone does not tell the full story; adoption trajectories and institutional pilots matter more during consolidation phases.
Solana (SOL): High Risk, High Optionality
Technical Overview
Solana’s rebound has stalled just below $95, indicating that bears are attempting to convert this level into resistance.
Solana daily chart with $95 resistance
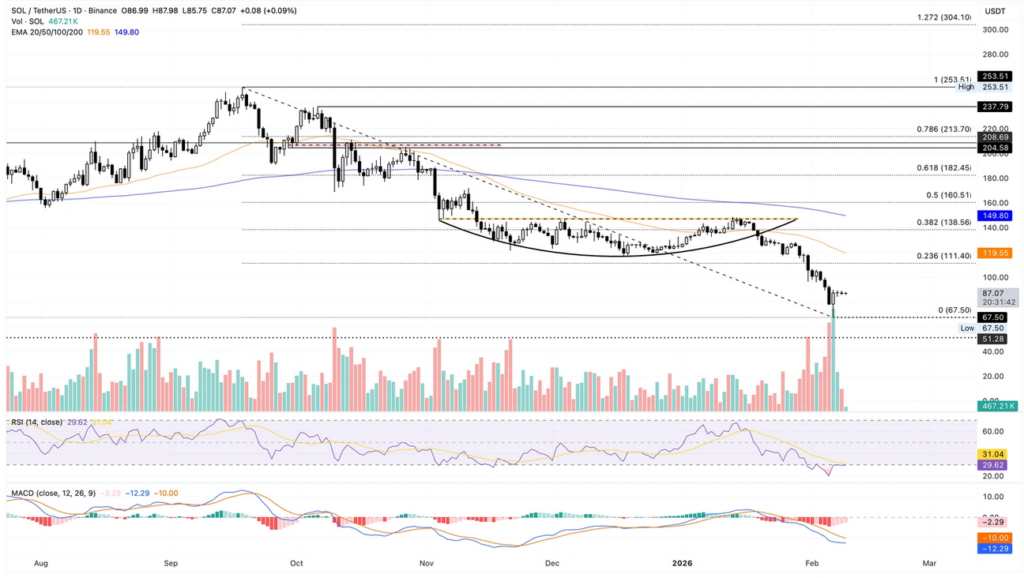
If SOL falls below $77, it would confirm continued bearish control, with a likely retest of $67, a historically strong support zone.
However, if price breaks above the $95–$104 zone (20-day EMA at $104), bullish momentum could accelerate toward the 50-day SMA near $123.
Practical Implications
Solana exemplifies the high-beta end of the crypto spectrum. For traders, it offers volatility. For builders, its low fees and fast settlement continue to attract consumer-facing applications, NFTs, and payment experiments—especially in emerging markets.
Broader Trends: Beyond the Charts
Recent data from derivatives markets shows declining funding-rate extremity, suggesting forced liquidations may be largely exhausted. On-chain metrics across major networks indicate reduced panic selling and gradual accumulation, particularly among long-term holders.
Institutionally, attention is shifting toward:
- Yield-bearing real-world assets (RWA)
- Stablecoin settlement infrastructure
- Regulated on/off-ramps and compliance-ready blockchain systems
These trends align with bottoming phases historically, where speculation gives way to utility-driven value creation.
Conclusion: Positioning for What Comes Next
While it is still too early to declare a definitive market bottom, current conditions strongly suggest we are in a bottom-formation zone rather than a euphoric top or panic collapse.
For readers seeking the next revenue source or practical blockchain application, this is not the time for blind leverage—but it is the time for:
- Strategic accumulation
- Yield and infrastructure exploration
- Building products that solve real financial and operational problems
In crypto, the loudest opportunities often appear after the crowd leaves—but before the trend returns.