Main Points :
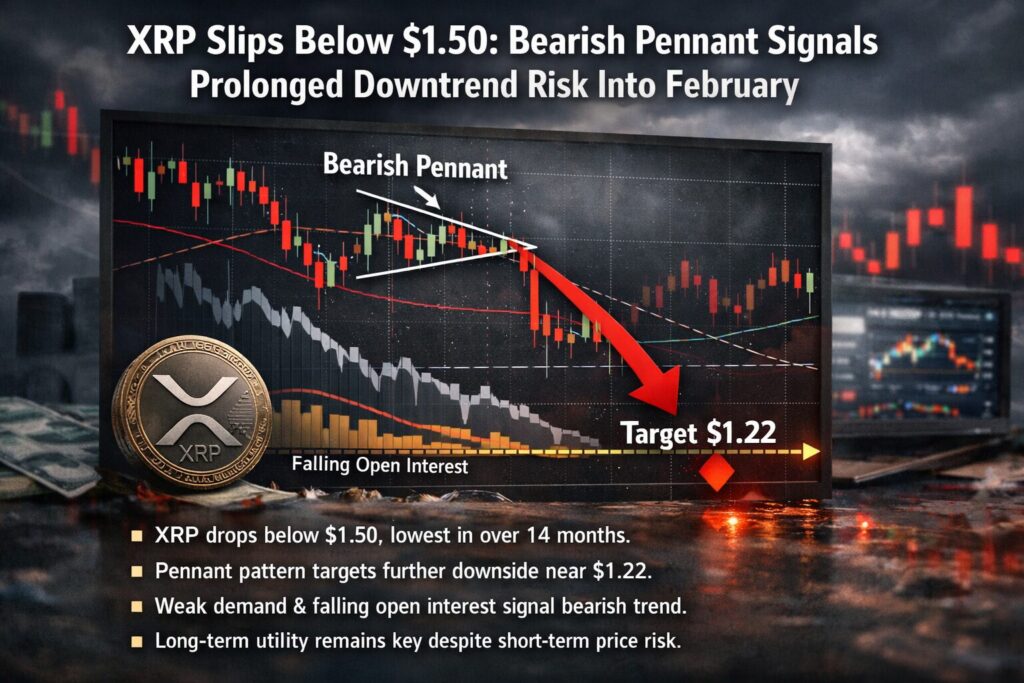
- XRP briefly fell below $1.50, marking its lowest level in over 14 months and confirming a bearish technical breakdown.
- A classic bearish pennant pattern suggests a potential downside target near $1.22, implying further downside risk of over 20%.
- On-chain and market data indicate weakening buyer momentum, with spot taker demand declining sharply over the past 30–90 days.
- Falling futures open interest may reduce downside pressure but does not yet confirm a bullish reversal.
- For investors and builders focused on practical blockchain use cases, XRP’s current phase highlights the importance of separating short-term price risk from long-term utility narratives.
1. XRP Breaks Below $1.50: A Critical Technical Event
XRP (XRP) experienced a sharp sell-off over the weekend, briefly dipping below the $1.50 level and registering its lowest price in approximately 14 months. This move followed a rapid decline of roughly 14% from a local high near $1.75, breaking below the $1.60 support zone that had held since November 2024.
From a technical analysis perspective, this breakdown is significant. The $1.60 region had functioned as a psychological and structural support, attracting dip buyers during previous corrections. Its loss signals a shift in market structure, reinforcing the view that XRP remains in a broader downtrend rather than a temporary pullback.
Market participants closely watching XRP/USD daily charts noted that the breakdown coincided with declining momentum indicators, reinforcing the bearish bias. The broader altcoin market has also shown signs of fatigue, but XRP’s move stands out due to the clarity of its chart patterns and the alignment with weakening on-chain demand.
[XRP/USD Daily Chart showing the break below $1.60 support]
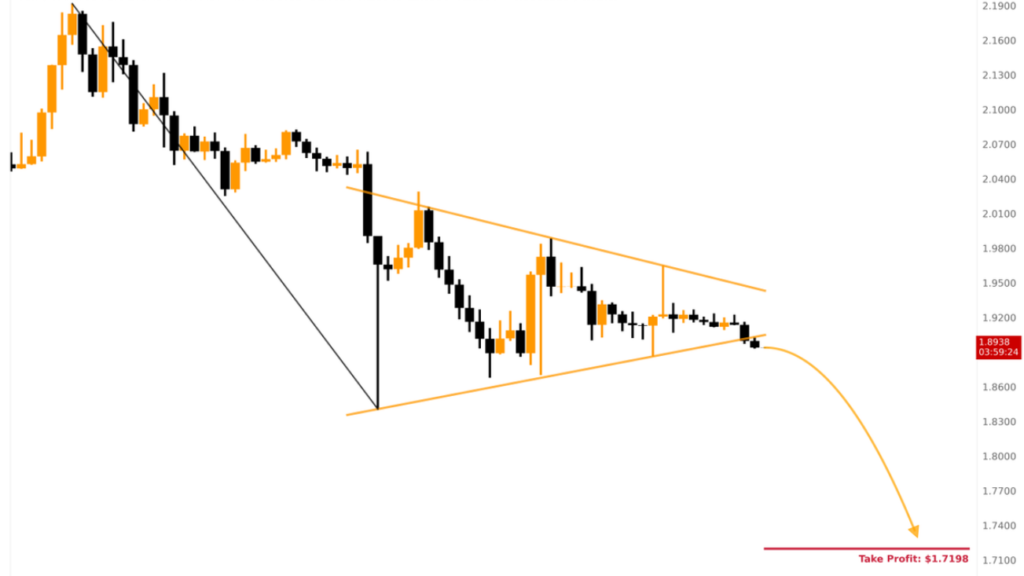
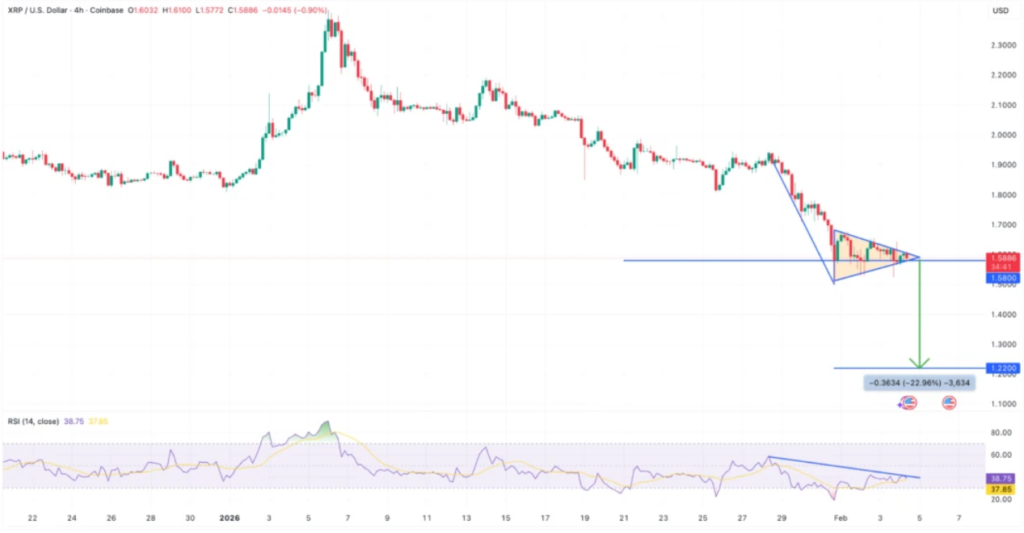
2. The Bearish Pennant Pattern and the $1.22 Target
One of the most discussed technical developments is the completion of a bearish pennant pattern on XRP’s lower-timeframe charts. A bearish pennant typically forms after a sharp downward move, followed by a period of consolidation within converging trendlines, and resolves with a continuation to the downside.
On the four-hour chart, XRP broke below the lower boundary of this pennant earlier in the week. The subsequent retest of the former support zone near $1.58 acted as resistance—a textbook confirmation of bearish continuation. If XRP continues to close four-hour candles below this level, technical traders expect downside acceleration.
The measured move target of the pennant projects a decline toward approximately $1.22, representing an additional drop of roughly 23% from current levels. Such a move would place XRP near zones last seen during previous macro corrections and could trigger further risk-off behavior among short-term holders.
[XRP/USD 4H Chart illustrating the bearish pennant and $1.22 target]
3. Was the January Rally to $2.40 a Fakeout?
The failed recovery attempt in January, when XRP briefly rallied toward $2.40, is increasingly being labeled a “fakeout” by market commentators. The rally lacked sustained volume and coincided with broader speculative enthusiasm rather than XRP-specific catalysts.
According to commentary circulating on X (formerly Twitter), the price action formed a lower high relative to earlier peaks, followed by a decisive breakdown to new local lows. This sequence reinforces the bearish trend structure: lower highs, lower lows, and weakening demand on rebounds.
Trader and investor Alex Clay highlighted that the breakdown below the $1.60 double-bottom support effectively opened the door for a move toward $1.00 or even lower if market conditions deteriorate further. Such views echo a growing consensus among technical traders that XRP remains vulnerable in the absence of strong catalysts.
4. Realized Price Support and Parallels With the 2022 Bear Market
XRP’s next major support zone lies near its realized price, around $1.48. The realized price represents the average acquisition cost of all circulating tokens and often acts as a critical psychological threshold. When price falls below this level, a majority of holders move into unrealized loss, increasing the risk of capitulation.
If XRP fails to reclaim and hold above the $1.48–$1.50 region, the market structure would begin to resemble the early stages of the 2022 bear market, during which XRP ultimately declined by more than 50% toward $0.30. While current macro conditions differ, the structural similarity is enough to warrant caution among risk-conscious investors.
For long-term participants, this comparison underscores the cyclical nature of crypto markets and the importance of distinguishing between speculative price cycles and the underlying adoption trajectory of blockchain networks.
5. Spot Taker Demand Collapses: What CVD Is Telling Us
On-chain and exchange data provide additional insight into XRP’s weakening demand profile. The 90-day spot taker cumulative volume delta (CVD) shows a sharp decline in aggressive buying since early January. CVD measures the net difference between market buy and sell orders, offering a real-time gauge of trader conviction.
Data from Cointelegraph-cited analytics providers indicate that while buy-side pressure dominated order books in late 2024, the past 30 days have seen a notable withdrawal of aggressive buyers. This shift suggests either investor exhaustion or a strategic retreat in anticipation of lower prices.
Historically, sharp drops in spot CVD for XRP have preceded price corrections ranging from 28% to 50% within subsequent weeks. While history does not guarantee repetition, the pattern reinforces the current downside risk profile.
[XRP Spot Taker CVD showing declining buyer aggression]
6. Falling Futures Open Interest: Early Stabilization or False Hope?
One potentially stabilizing factor in the current downturn is the sharp decline in XRP futures open interest (OI). As of midweek, total OI had fallen to approximately $2.61 billion, down from around $4.55 billion in early January.
A reduction in open interest during a price decline can signal that leveraged positions are being unwound, reducing forced selling pressure. In some cases, this process lays the groundwork for a more sustainable base and eventual trend reversal.
However, falling OI alone is not sufficient to confirm a bullish shift. Without a corresponding increase in spot demand and volume, any bounce risks remaining corrective rather than impulsive. Bulls would need to reclaim key resistance levels—particularly around $1.85, which acted as support for much of 2025—to meaningfully challenge the prevailing bearish narrative.
7. Broader Market Context and Practical Implications for Builders
Beyond price action, XRP’s current phase offers important lessons for investors and builders focused on real-world blockchain applications. XRP and the XRP Ledger continue to be positioned around cross-border payments, liquidity provisioning, and enterprise use cases. These narratives, however, often move on different timelines than speculative price cycles.
For those seeking new revenue opportunities or practical blockchain integrations, the present downturn may represent a period of reassessment rather than abandonment. Volatile price phases tend to flush out excess leverage and speculative froth, potentially creating more stable conditions for long-term development and partnerships.
At the same time, treasury managers, fintech operators, and crypto-native businesses must remain mindful of short-term price risk when holding or utilizing volatile digital assets. Risk management, hedging strategies, and clear separation between operational liquidity and speculative exposure are essential.
8. Conclusion: Navigating XRP’s Uncertain February Outlook
XRP’s drop below $1.50 marks a decisive technical breakdown that aligns with weakening buyer demand and bearish chart structures. The completion of a bearish pennant pattern points to a potential move toward $1.22, while the loss of realized price support could exacerbate downside risk if sentiment continues to deteriorate.
That said, declining futures open interest suggests that some of the excess leverage has already been flushed from the system, leaving room for stabilization if broader market conditions improve. For now, XRP remains at a crossroads, caught between near-term bearish momentum and longer-term utility-driven narratives.
For investors and practitioners interested in the practical use of blockchain technology, this period reinforces a familiar lesson: price volatility and technological progress do not always move in lockstep. Navigating XRP’s current environment requires both technical vigilance and a clear understanding of one’s time horizon and risk tolerance.