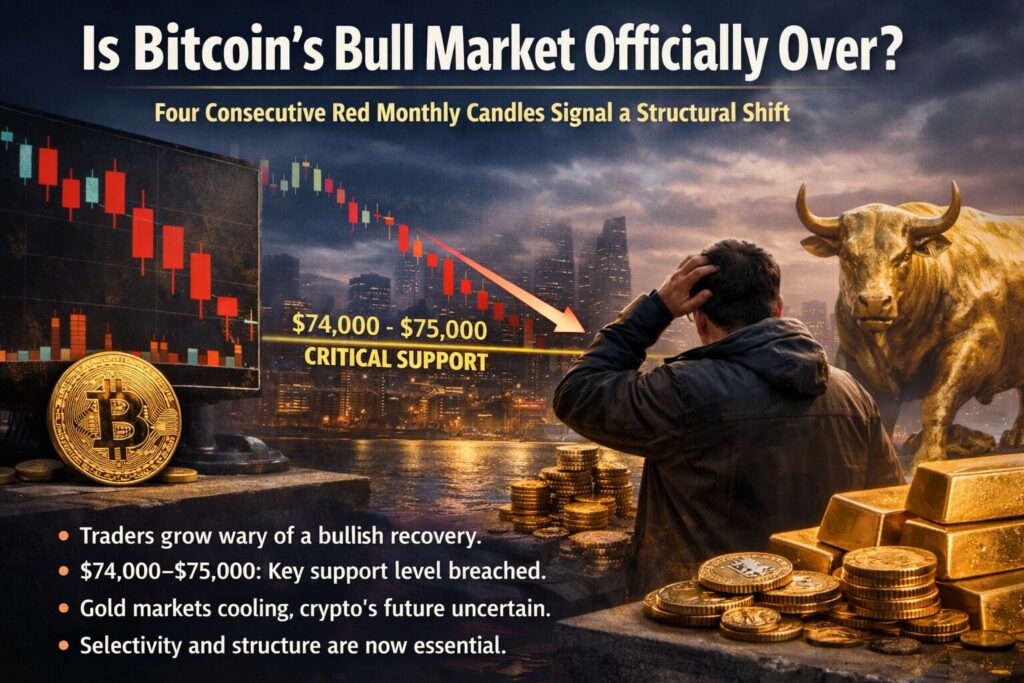
Main Takeaways :
- Bitcoin has recorded four consecutive monthly red candles, a rare pattern previously seen only during major bear markets.
- Many traders and analysts are abandoning the assumption of a near-term bull market recovery.
- The $74,000–$75,000 range has become a critical structural support level for Bitcoin.
- A cooling gold market may eventually redirect capital toward crypto, but timing remains uncertain.
- For investors seeking new digital assets and revenue opportunities, selectivity and structure matter more than narrative in the current phase.
Introduction: A Market Losing Its Bullish Conviction
At the start of the latest Wall Street trading session, Bitcoin attempted to stabilize after another sharp decline. Yet beneath the surface, sentiment among traders has shifted decisively. Expectations of a quick return to a full-scale bull market are fading, replaced by cautious positioning and outright bearish projections.
Bitcoin’s price action has now entered historically rare territory: four consecutive months of negative monthly closes. This pattern has appeared only twice before—during the deep bear markets of 2014 and 2018. While history never repeats perfectly, market participants are increasingly questioning whether the previous cycle’s peak has already passed.
For readers searching for new crypto assets, alternative income streams, or practical blockchain use cases, this moment is less about panic and more about reframing strategy.
Four Red Monthly Candles: Why This Matters
[Bitcoin Monthly Returns – Highlighting Four Consecutive Red Candles]
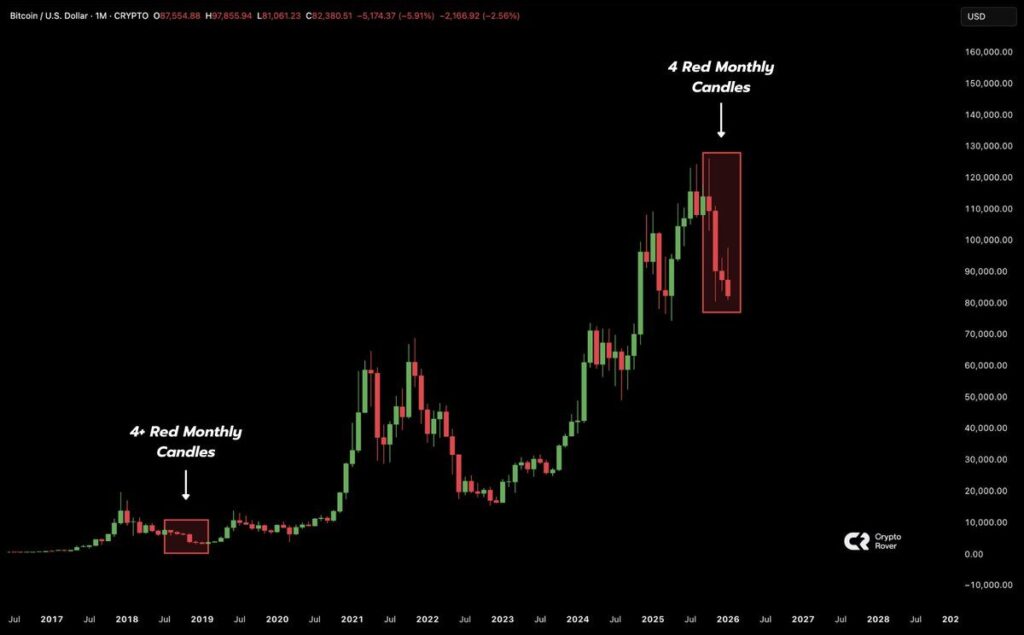
According to data from CoinGlass, Bitcoin closed January with its fourth consecutive monthly loss. Historically, this has been a powerful signal:
- 2014: Followed the collapse of the early Bitcoin bubble.
- 2018: Marked the unwinding of the ICO-driven bull cycle.
- 2025–2026: The current case, unfolding under very different macro conditions.
What makes the present situation unique is that this downturn comes after institutional adoption, spot ETFs, and broader financial integration. The market is no longer driven purely by retail speculation, which means downside phases can be slower, more complex, and more psychologically exhausting.
Was $126,000 the Cycle Top?
[BTC Weekly Chart Showing the $126,000 Peak]
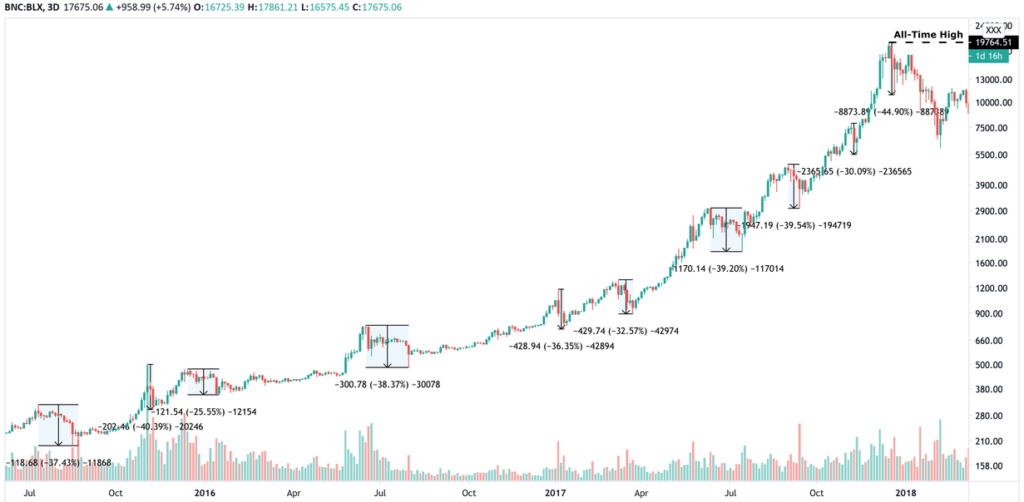
Several prominent traders have publicly stated that Bitcoin’s peak around $126,000 may represent the definitive top of this cycle. Weekly charts show a clear break in structure, with lower highs and lower lows forming since that point.
From a technical perspective:
- The weekly trend has flipped from accumulation to distribution.
- Momentum indicators have failed to reclaim bullish territory.
- Attempts at rebounds have been sold aggressively.
This does not imply that Bitcoin is “dead,” but it does suggest that time, not price alone, will be required before a sustainable reversal emerges.
The $74,000 Support Zone: Last Line Before Deeper Decline?
[Key Support Zone Around $74,000]
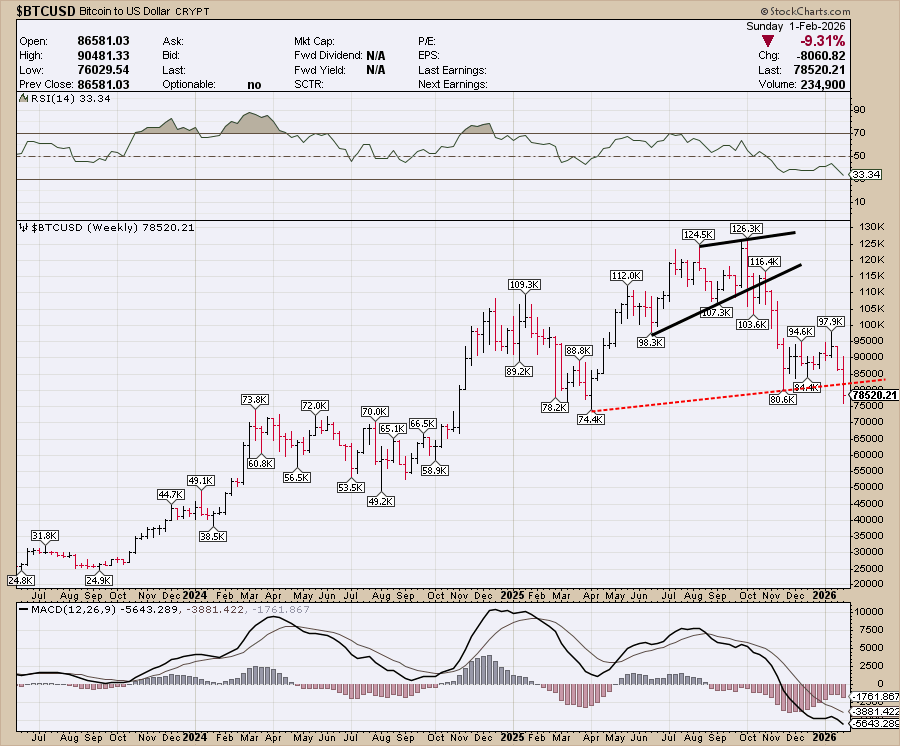
Bitcoin recently printed a 16-month low near $74,532 on Bitstamp. Market commentary increasingly clusters around scenarios involving a decisive break below $74,000.
Market-making firms have noted that:
- A clean weekly close below this level could open the door to a broader return to the 2024 trading range.
- Liquidity below $70,000 remains relatively thin, increasing volatility risk.
- Few traders currently expect a V-shaped recovery.
In practical terms, this environment favors capital preservation, structured yield strategies, and selective exposure, rather than aggressive directional bets.
Gold, Macro Rotation, and Crypto’s Delayed Opportunity
[Bitcoin vs Gold – Weekly Comparison]
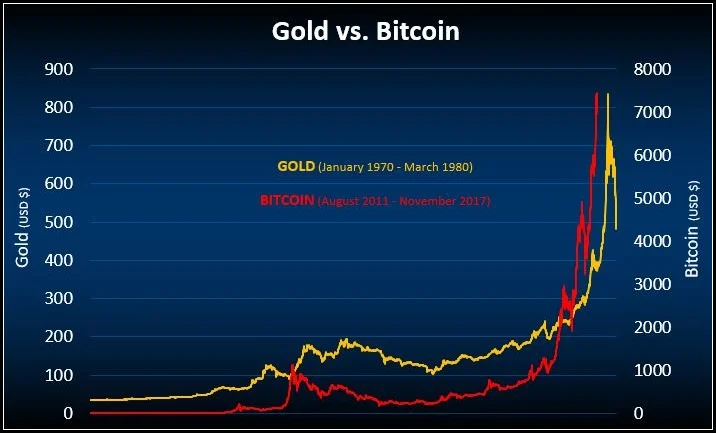
An interesting counterpoint to Bitcoin’s weakness is the recent behavior of gold. After surging to record highs, gold corrected sharply and has begun stabilizing around $4,700 per ounce.
Several macro factors contributed:
- Overbought conditions in precious metals.
- Rising margin requirements in futures markets.
- Shifts in expectations around future US monetary leadership.
Historically, Bitcoin has often followed gold with a lag, not a mirror. Some analysts argue that once gold’s momentum fully cools, speculative and institutional capital may once again search for higher-beta alternatives—crypto among them.
However, this is not a short-term guarantee. The transition can take months or even years, particularly in a tightening liquidity environment.
What This Means for Crypto Investors and Builders
For those exploring new digital assets or blockchain-based revenue models, the implications are clear:
- Narratives matter less than structure
Projects with real cash flow, infrastructure relevance, or regulatory alignment outperform hype-driven tokens in downtrends. - Volatility is not the enemy—poor risk design is
Yield strategies, hedged exposure, and multi-asset positioning become more important than directional bets. - Bitcoin remains the reference point
Even in a bearish phase, Bitcoin defines liquidity cycles for the entire crypto market.
This is often the phase when foundational positions are built—quietly and patiently—by those with a long-term view.
Conclusion: End of the Bull Market, or Just the End of Illusion?
Bitcoin’s four consecutive red monthly candles are not a trivial technical detail. They represent a broader psychological and structural shift in the market. While it is increasingly difficult to argue for an immediate return to a euphoric bull phase, it would be equally mistaken to declare the long-term thesis invalid.
For investors and operators focused on practical blockchain use, this period is less about chasing price and more about building position, discipline, and understanding. History suggests that the seeds of the next expansion are often planted during moments like this—when optimism is scarce, but infrastructure quietly matures.