Main Points :
- XRP has fallen sharply to the $1.70 range after failing to hold key technical levels above $2.00.
- A clear “death cross” on the 4-hour chart confirms a bearish momentum shift.
- The breakdown follows a rounded-top formation, signaling the end of the prior uptrend.
- Short-term downside risk extends toward $1.60 if current support fails.
- Broader crypto market conditions and XRP’s real-world utility narrative are diverging, creating both risks and long-term opportunities.
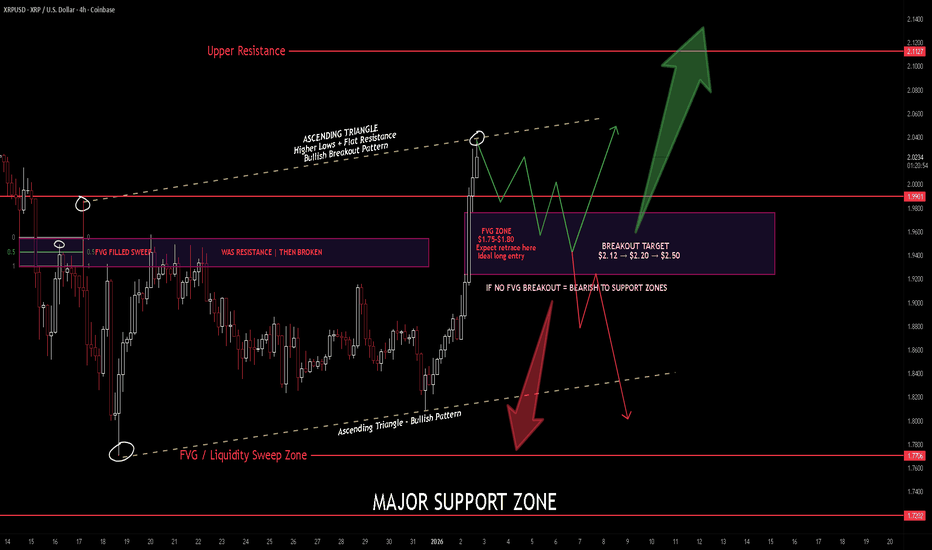
[XRP/USD 4-hour chart with 7 EMA and 28 EMA (TradingView style)]
1. XRP’s Sudden Drop to the $1.70 Zone
On January 31, XRP was trading around $1.72, marking a sharp decline over the previous 24 hours. This move represents a dramatic reversal from levels above $2.30 seen earlier in the year. The speed and structure of the drop have caught market participants off guard, especially those who had positioned for a continuation of the late-2025 rally.
From a price-action perspective, this was not a random sell-off. The decline unfolded in a technically orderly but psychologically damaging manner, breaking multiple support levels that had previously encouraged dip-buying behavior. Once XRP lost the $2.00 psychological threshold, selling pressure intensified as both retail traders and short-term systematic strategies exited positions.
This move has placed XRP firmly back into a corrective phase, forcing investors to reassess whether the asset is experiencing a temporary pullback or entering a more prolonged bearish cycle.
2. Death Cross on the 4-Hour Chart: Momentum Turns Bearish
One of the clearest technical signals accelerating the decline is the death cross observed on the 4-hour chart. Specifically, the short-term 7-period Exponential Moving Average (EMA) crossed below the longer-term 28-period EMA.
This pattern is widely regarded as a strong bearish signal, particularly in liquid markets like XRP where algorithmic trading and momentum-based strategies play a significant role. The death cross indicates that short-term momentum has decisively shifted to the downside, overpowering medium-term trend support.
Currently, XRP’s price remains well below both EMA lines, which have now flipped from dynamic support into active resistance zones. The area around $1.75, where the 7 EMA resides, has repeatedly rejected upward price attempts, confirming the lack of meaningful buying pressure.
For traders, this configuration suggests that any near-term rebound is likely to face strong selling unless accompanied by a clear surge in volume.
[EMA resistance zones highlighting $1.75–$1.82]
3. Rounded Top Formation and Breakdown Confirmation
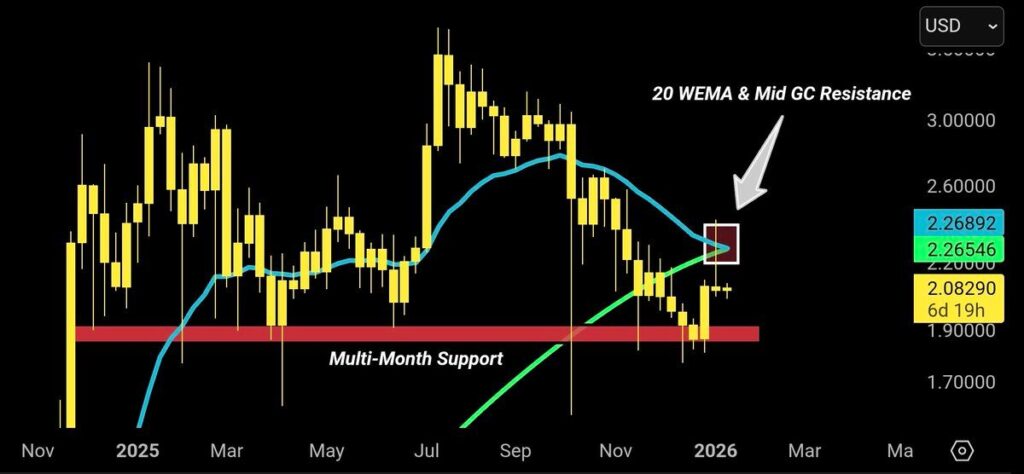
Zooming out to a broader view, XRP’s recent behavior aligns closely with a classic rounded top formation. After peaking near $2.40 in early January, the asset began forming progressively lower highs, signaling distribution rather than accumulation.
Rounded tops are particularly dangerous for late-stage buyers because they often mask weakness behind sideways price action. Once the pattern completes, downside moves tend to accelerate quickly as latent selling pressure is released.
The breakdown below $2.00 effectively confirmed the pattern, removing a key technical and psychological support zone. With that level gone, the market is now focused on whether $1.70 can function as a temporary floor or merely a pause before further declines.
4. Key Support and Downside Risk Toward $1.60
At present, $1.70 represents the most immediate support level. Market participants are closely watching price behavior in this zone, particularly for signs of:
- High-volume absorption by buyers
- Long lower wicks indicating rejection of lower prices
- Momentum indicators such as RSI approaching oversold territory
If this support fails decisively, the next logical downside target sits around $1.60, corresponding to early-December lows. From a risk-management standpoint, this level also aligns with where medium-term swing buyers may attempt re-entry.
However, until momentum indicators clearly signal exhaustion, the prevailing trend remains downward. In such environments, attempting to “catch the bottom” often proves costly without confirmation.
5. Bullish Recovery Scenario: What Would It Take?
Despite the current bearish structure, a bullish reversal scenario is not impossible—but it would require decisive action from buyers.
For XRP to regain constructive momentum, price would need to reclaim the $1.75–$1.82 range, where multiple EMA levels are clustered. More importantly, this move would need to be supported by a visible expansion in trading volume, signaling genuine demand rather than short covering.
Without these conditions, any bounce is likely to remain corrective in nature, serving as an opportunity for sellers rather than a trend reversal.
6. Broader Market Context: XRP vs. the Crypto Cycle
XRP’s decline is occurring against a mixed backdrop in the broader crypto market. While some large-cap assets are consolidating rather than collapsing, capital rotation has become increasingly selective. Assets without immediate narrative catalysts or strong inflows are experiencing sharper corrections.
At the same time, XRP occupies a unique position in the crypto ecosystem. Unlike purely speculative tokens, XRP continues to emphasize real-world payment infrastructure, cross-border settlement, and institutional integration.
This creates a divergence between short-term technical weakness and long-term utility-driven potential—a dynamic that appeals differently to traders and builders.
7. Implications for Investors, Traders, and Builders
For short-term traders, the message is clear: trend-following discipline remains essential. The current structure favors caution, tight risk controls, and patience.
For longer-term investors and blockchain practitioners, however, periods of technical stress often provide valuable insight. Declining prices can expose which projects retain development momentum, partnerships, and real adoption beyond market hype.
XRP’s price action may be under pressure, but its role in enterprise-grade payment discussions remains relevant. For those focused on infrastructure, liquidity solutions, or regulated financial use cases, volatility may present strategic entry points rather than existential threats.
Conclusion: A Critical Test for XRP at $1.70
XRP’s rapid decline to the $1.70 level marks a critical juncture. The death cross, EMA resistance, and rounded-top breakdown all reinforce a bearish short-term outlook. Unless buyers reclaim key levels with conviction, downside risk toward $1.60 remains firmly on the table.
At the same time, this correction forces a broader reassessment of XRP’s role—not just as a trading instrument, but as a blockchain asset tied to real-world financial infrastructure. How the market responds at these levels will shape sentiment well beyond the coming weekend.