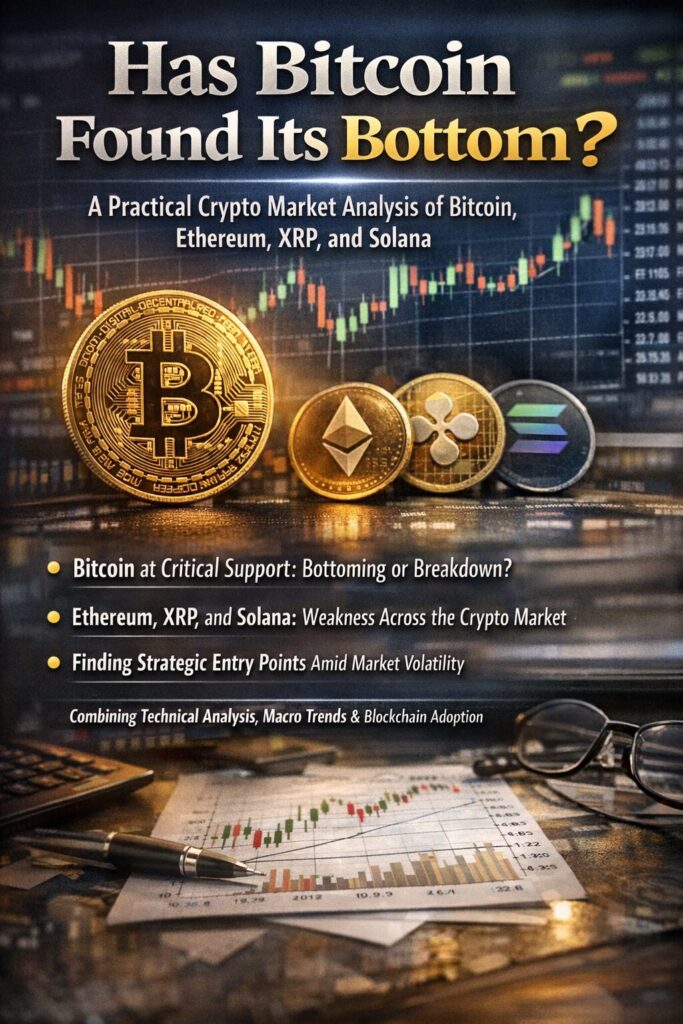
Main Points :
- Bitcoin is testing a critical support zone that may define whether the current correction becomes a deeper bearish phase or a medium-term accumulation opportunity.
- Ethereum, XRP, and Solana are all showing structurally similar weakness, but each asset presents distinct risk–reward profiles depending on investor time horizon.
- For investors seeking new revenue sources and practical blockchain exposure, volatility itself may create strategic entry points rather than purely speculative risks.
- Technical analysis should be combined with macro liquidity trends, institutional behavior, and real-world blockchain adoption signals.
1. Market Context: Why “Has Bitcoin Bottomed?” Matters Now
The question of whether Bitcoin has formed a bottom is not merely a short-term trading concern. It has significant implications for capital allocation, portfolio construction, and the broader crypto market cycle. Bitcoin often acts as the liquidity anchor for the entire digital asset ecosystem. When BTC stabilizes, risk appetite tends to return not only to major altcoins like Ethereum but also to emerging Layer 1s, infrastructure tokens, and application-specific blockchain projects.
Recent market behavior shows Bitcoin sharply rejecting the 20-day Exponential Moving Average (EMA) around $89,165, followed by a breakdown below the $84,000 support level. This move has reignited bearish narratives, but it has also brought price into a historically important decision zone.
At the same time, macro conditions remain mixed. Global liquidity is neither aggressively tightening nor clearly easing, creating an environment where technical levels regain importance. For investors focused on identifying the next yield opportunity—whether through directional exposure, structured products, or blockchain-based financial primitives—this phase is especially critical.
2. Bitcoin (BTC): A Battle at the Edge of Market Conviction
Bitcoin’s daily chart reveals a textbook confrontation between buyers and sellers. After failing to hold above its short-term moving averages, BTC slipped below $84,000, signaling short-term weakness. The most important level to monitor now is $80,600.
If sellers manage to push BTC decisively below $80,600, the next major support sits near $74,508. A move toward that level would likely flush out remaining leveraged long positions and could trigger forced selling across derivative markets. From a risk management perspective, such a scenario represents the “capitulation-lite” phase that often precedes medium-term bottoms.
However, the bullish alternative cannot be ignored. Should buyers successfully defend the $80,600 level and reclaim the moving averages, the recent drop below $84,000 would be reclassified as a false breakdown. In that case, BTC could rapidly rebound toward the $94,789–$97,924 resistance zone.
This range is particularly important for institutional players. A recovery into that zone would signal that demand remains structurally intact, reinforcing Bitcoin’s role as a digital reserve asset rather than a purely speculative instrument.
Bitcoin (BTC/USD) Daily Chart
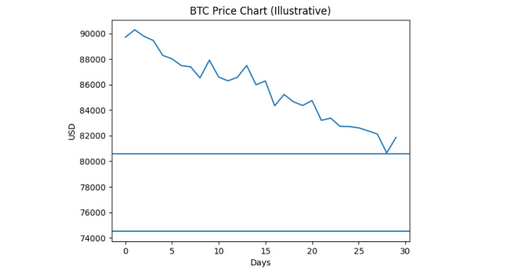
- Support: $80,600 / $74,508
- Resistance: $94,789 – $97,924
(Visual: daily candlesticks, 20-day EMA, support/resistance zones)
3. Ethereum (ETH): Weak Momentum, Strong Long-Term Utility
Ethereum has mirrored Bitcoin’s weakness but with additional structural pressure. ETH fell below $2,787 after failing to sustain momentum near its moving averages. The downward-sloping 20-day EMA at approximately $2,999, combined with a negative Relative Strength Index (RSI), suggests sellers currently control the short-term narrative.
The next notable support lies around $2,623, a level where dip buyers may emerge. This zone has historically attracted demand from investors with a longer-term view, particularly those focused on Ethereum’s role in decentralized finance (DeFi), tokenization, and enterprise blockchain infrastructure.
If bearish pressure intensifies, however, ETH could revisit the $2,111 area. While such a move would appear severe on a chart, it would also coincide with valuation zones that long-term participants often consider attractive from a risk-adjusted perspective.
For Ethereum, technical weakness must be weighed against its unmatched developer ecosystem, staking yield dynamics, and expanding use in real-world asset (RWA) tokenization. A decisive move back above the moving averages would significantly improve short-term sentiment and open a path toward the descending resistance line.
Ethereum (ETH/USD) Daily Chart
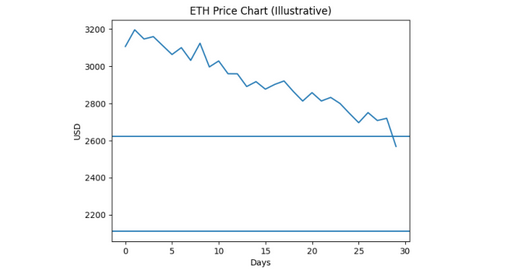
- Support: $2,623 / $2,111
- Resistance: $2,999 and descending trendline
(Visual: EMA, RSI indicator, key support levels)
4. XRP: Structural Pressure Amid Regulatory and Utility Narratives
XRP remains under persistent pressure after falling below $1.77, once again rejecting its moving averages. This price action suggests that bearish participants still dominate near-term trading.
The $1.61 level now serves as a critical inflection point. A clear breakdown below this support could send XRP toward the lower boundary of its descending channel, extending the corrective phase.
That said, XRP occupies a unique position in the crypto landscape. Its focus on cross-border settlement, liquidity provisioning, and institutional payment rails differentiates it from purely speculative assets. Even if price remains capped in the short term, periods of consolidation may appeal to investors looking for asymmetric exposure tied to regulatory clarity and real-world adoption rather than hype cycles.
A successful breakout above the moving averages and, ultimately, the descending trendline would indicate a meaningful shift in market control back to buyers.
XRP (XRP/USD) Daily Chart
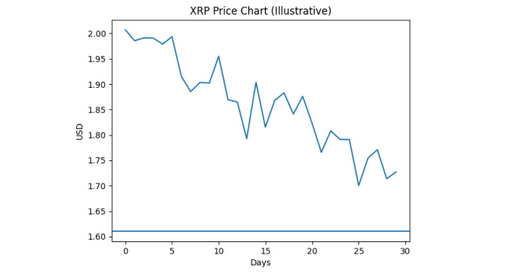
- Support: $1.61
- Resistance: moving averages and descending trendline
(Visual: descending channel structure)
5. Solana (SOL): High Volatility, High Optionality
Solana recently broke down from a prolonged $117–$147 range, signaling a potential transition from consolidation to expansion—unfortunately to the downside for now. If SOL closes below $117, the next support emerges near $95.
The $95 level is particularly important. Strong buyer defense here would suggest that the recent breakdown was driven more by market-wide risk-off behavior than by Solana-specific weakness. Failure to hold this level, however, could expose SOL to a sharper decline toward $79.
From a strategic standpoint, Solana represents high optionality. Its fast settlement times, low fees, and growing application ecosystem make it attractive for consumer-facing blockchain use cases. For investors willing to tolerate volatility, periods of sharp drawdowns may offer entry points aligned with long-term adoption narratives.
If buyers manage to reclaim the moving averages, the recent move below $117 would be classified as a bear trap, opening the door for a rebound toward $147.
Solana (SOL/USD) Daily Chart
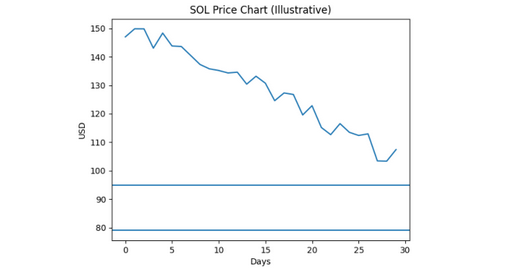
- Support: $95 / $79
- Resistance: $117 / $147
(Visual: range breakdown and potential bear trap)
6. Strategic Implications for Investors and Builders
For readers searching for new crypto assets, the current environment emphasizes selectivity over broad exposure. Rather than chasing momentum, this phase rewards disciplined analysis of downside risk, structural support, and real-world utility.
For those exploring the next revenue source, volatility itself can be monetized through structured products, yield strategies, or infrastructure plays that benefit regardless of price direction. Meanwhile, builders and operators focused on practical blockchain usage should view market corrections as periods of reduced noise—ideal for long-term positioning.
7. Conclusion: Bottom or Not, Opportunity Is Being Defined
Whether Bitcoin has already formed a bottom or still needs one final washout remains uncertain. What is clear, however, is that the market is approaching levels where risk and opportunity begin to balance more favorably for informed participants.
Bitcoin’s defense of $80,600, Ethereum’s behavior near $2,623, XRP’s reaction at $1.61, and Solana’s test of $95 will collectively shape the next phase of the crypto market. For investors and professionals focused on sustainable returns and real-world blockchain adoption, this is not a time for emotional decisions—but for structured, forward-looking strategy.