Main Points :
- Bitcoin’s composite technical score has fallen to 1.7 out of 5, indicating significant weakness across trend and momentum indicators.
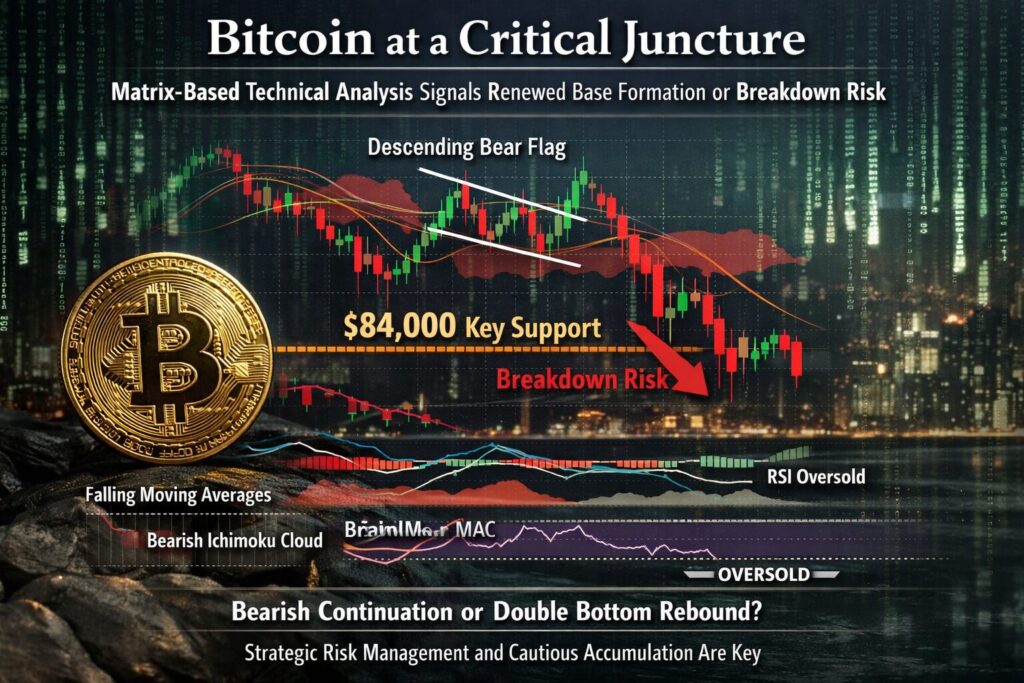
- A descending flag pattern has completed, increasing the probability of a bearish continuation if key support fails.
- The USD-equivalent of the JPY 12.65 million level (approx. $84,000) represents a decisive support zone.
- Trend indicators (moving averages, Ichimoku, Bollinger Bands, MACD) all point downward, while RSI has entered oversold territory.
- A double-bottom rebound remains possible, but a breakdown would likely confirm a transition into a full bearish market phase.
- For investors and blockchain practitioners, this phase emphasizes risk management, liquidity planning, and strategic accumulation discipline rather than aggressive leverage.
1. Introduction: Why Objective, Multi-Factor Technical Analysis Matters Now
Bitcoin has entered another decisive phase where emotional reactions and single-indicator interpretations can easily lead investors astray. In periods of heightened volatility, particularly when prices revisit major retracement levels, objectivity and consistency in technical observation become critical.
This article is based on a matrix-style technical analysis approach originally published by Rakuten Wallet analyst Yasuo Matsuda on January 30, 2026. The methodology evaluates Bitcoin using six widely accepted technical tools—pattern analysis, moving averages, Ichimoku Cloud, Bollinger Bands, MACD, and RSI—each scored on a five-point scale. The average score provides a structured, repeatable assessment of market strength.
Beyond summarizing that analysis, this article places the findings into a broader market context, incorporating recent global crypto trends and practical implications for investors seeking new digital assets, revenue opportunities, or real-world blockchain use cases.
2. Technical Overview: Pattern Analysis Signals a Make-or-Break Moment
Daily and Weekly Chart Structure
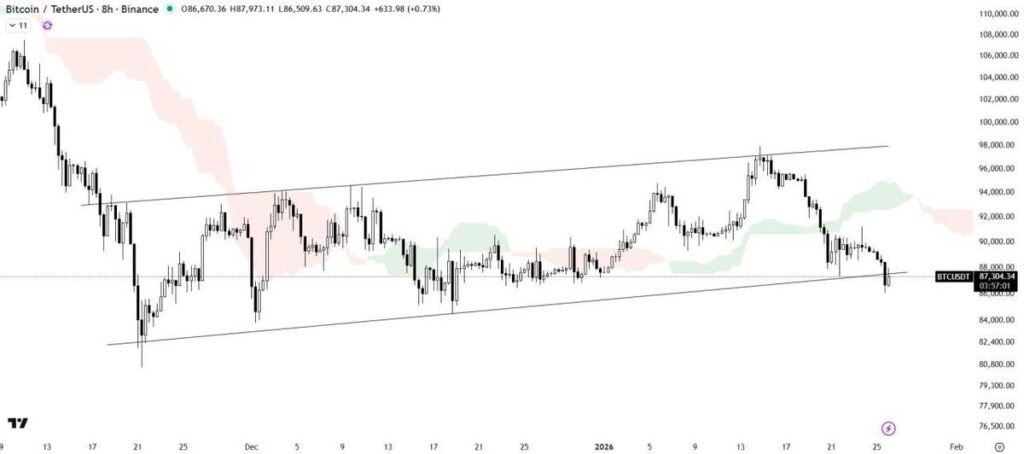
In the prior analysis, Bitcoin failed to break above the 50% retracement of its previous decline, instead forming a long upper wick and reversing lower. More importantly, the price decisively broke below the 50% pullback level from the prior bottom, confirming that the rebound lacked structural strength.
This move completed a descending flag pattern, a classic continuation formation that typically resolves in the direction of the prevailing downtrend.
Converted to USD terms, the critical support discussed corresponds to approximately $84,000. This level marks the prior major low and now serves as the market’s psychological and technical dividing line.
If Bitcoin holds this zone and forms a double bottom, the current phase may remain a correction within a broader consolidation. However, a decisive breakdown would imply a measured-move target near $61,000, consistent with historical volatility behavior in Bitcoin markets.
Pattern Analysis Score: 2 / 5
3. Trend Indicators: Moving Averages and Ichimoku Confirm Bearish Bias
Moving Averages (9-day and 25-day)
Both short-term and medium-term moving averages have formed a dead cross, with both lines sloping downward. This configuration reflects sustained selling pressure and a lack of short-term momentum recovery.
In practical trading terms, this environment discourages trend-following long positions and favors either defensive positioning or short-term tactical trades only.
Ichimoku Cloud
Bitcoin has clearly broken below the Ichimoku Cloud, triggering what is known as a three-factor bearish reversal signal. Price is below the cloud, the conversion line is below the base line, and the lagging span confirms weakness.
This alignment historically coincides with prolonged consolidation or further downside unless a rapid reclaim of the cloud occurs.
Moving Averages Score: 1 / 5
Ichimoku Score: 1 / 5
4. Volatility and Momentum: Bollinger Bands and MACD Reinforce Downtrend
Bollinger Bands
Bitcoin is currently experiencing a downward band walk, where price persistently hugs the lower Bollinger Band. This behavior indicates strong directional momentum rather than mean reversion.
While band walks can become exhausted, they often persist longer than expected, especially in macro-driven risk-off environments.
MACD
MACD has also confirmed a dead cross, with both the MACD line and signal line trending lower. No bullish divergence is visible at this stage, reinforcing the view that downside momentum has not yet structurally reversed.
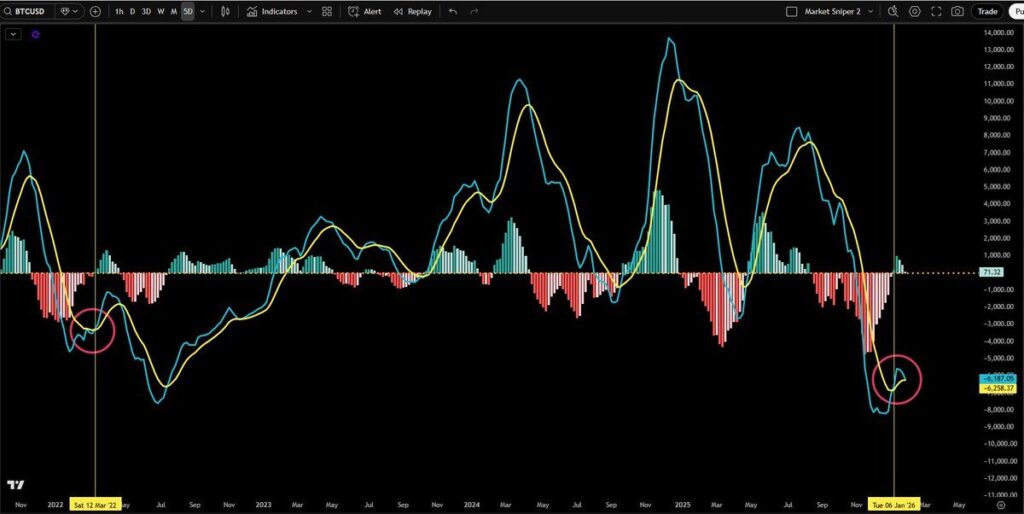
Bollinger Bands Score: 1 / 5
MACD Score: 1 / 5
5. RSI: Oversold Conditions Offer Hope, But Not Certainty
The Relative Strength Index has fallen below 30, entering the oversold zone. From a tactical perspective, this suggests that immediate downside risk may be limited, as sellers become exhausted.
However, oversold does not mean undervalued. In bearish market regimes, RSI can remain below 30 for extended periods. Therefore, RSI should be interpreted as a timing indicator, not a trend reversal signal on its own.
RSI Score: 2 / 5
6. Composite Matrix Evaluation and Market Regime Interpretation
Averaging all six indicators results in a composite score of 1.7, placing Bitcoin firmly in a weak technical state.
Historically, Bitcoin differs from traditional equities in volatility magnitude. While a 20% drawdown might signal a bear market in stocks, Bitcoin often requires a 40% decline to confirm a true bearish regime. The $84,000 support zone effectively represents that threshold.
- Hold above support → corrective consolidation phase
- Break below support → transition into bearish market structure
7. Practical Implications for Investors and Blockchain Operators
For readers seeking new crypto assets or revenue opportunities, this environment favors selectivity and capital preservation. Projects with real cash flow, infrastructure relevance (custody, payments, compliance tooling), and strong balance sheets historically outperform during weak Bitcoin phases.
For blockchain practitioners, periods like this often accelerate adoption of:
- Stablecoin-based settlement
- Treasury risk management systems
- On-chain transparency and monitoring tools
In other words, speculative froth fades, but practical blockchain use cases quietly expand.
8. Conclusion: A Market That Demands Discipline, Not Prediction
Bitcoin stands at a technical crossroads. While oversold conditions may spark short-term rebounds, the dominant trend remains fragile. Whether this phase becomes a renewed base formation or a confirmed breakdown will depend on how the market behaves around the $84,000 support zone.
For serious investors and builders, the message is clear: this is not a time for emotional decision-making. It is a time for disciplined observation, liquidity planning, and strategic positioning for the next cycle.