Main Points :
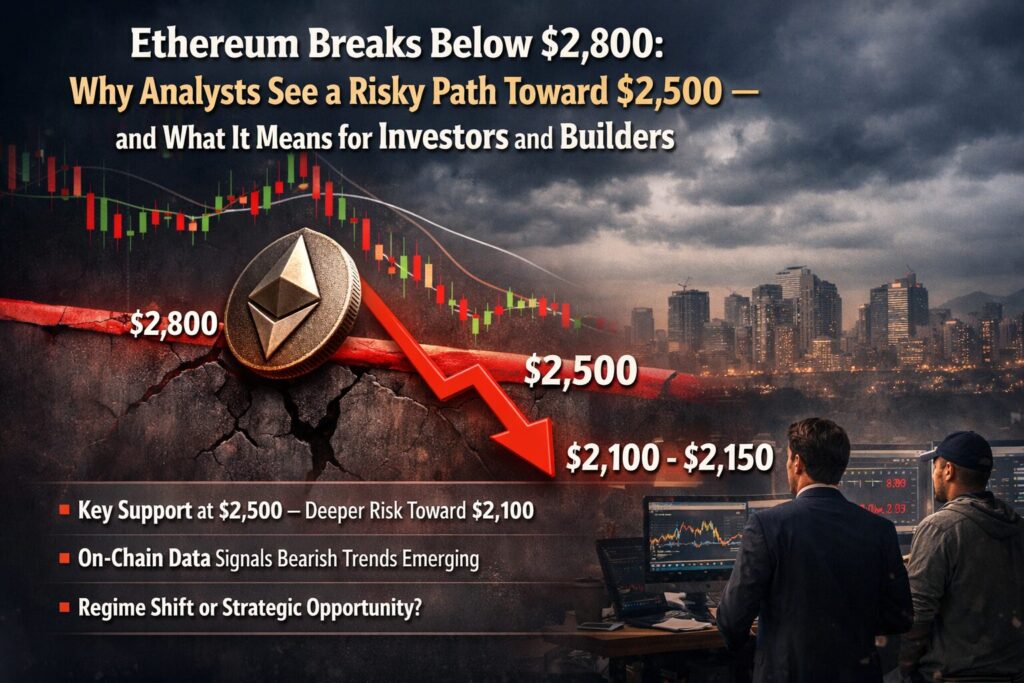
- Ethereum has decisively broken below the critical $2,800 support level, accelerating bearish momentum.
- Technical chart patterns now point toward $2,500 as the next major support, with deeper downside risks near $2,100–$2,150.
- On-chain indicators such as NUPL and long-term moving averages resemble early stages of previous Ethereum bear markets.
- Market structure suggests this is not merely short-term volatility, but a potential regime shift.
- For investors and blockchain practitioners, the current phase may represent both heightened risk and strategic accumulation opportunities.
1. Ethereum’s Breakdown Below $2,800: A Structural Shift, Not Just a Dip
Ethereum (ETH), the second-largest cryptocurrency by market capitalization, has entered a technically fragile phase after losing the psychologically and structurally important $2,800 level. Over the past three days, ETH/USD has fallen more than 10%, marking its first sustained breakdown below $2,800 since December 3, 2025.
At the time of writing, ETH is trading around $2,700, but analysts warn that the loss of $2,800 is not merely a short-term fluctuation. Instead, it signals a transition into a lower trading range where bearish momentum may dominate.
According to analyst MetaCryptoX, the $2,800 level represented a “line between life and death for bulls.” Failure to reclaim and hold above this zone would confirm bearish control, opening the path toward the $2,500 region — a level that historically attracts long-term buyers but also reflects market stress.
This breakdown is particularly significant because $2,800 had served as the horizontal support line of a descending triangle pattern, a formation that often resolves to the downside during broader market weakness.
2. Technical Indicators Converge Around $2,100–$2,500
From a purely technical perspective, Ethereum’s current setup is increasingly bearish.
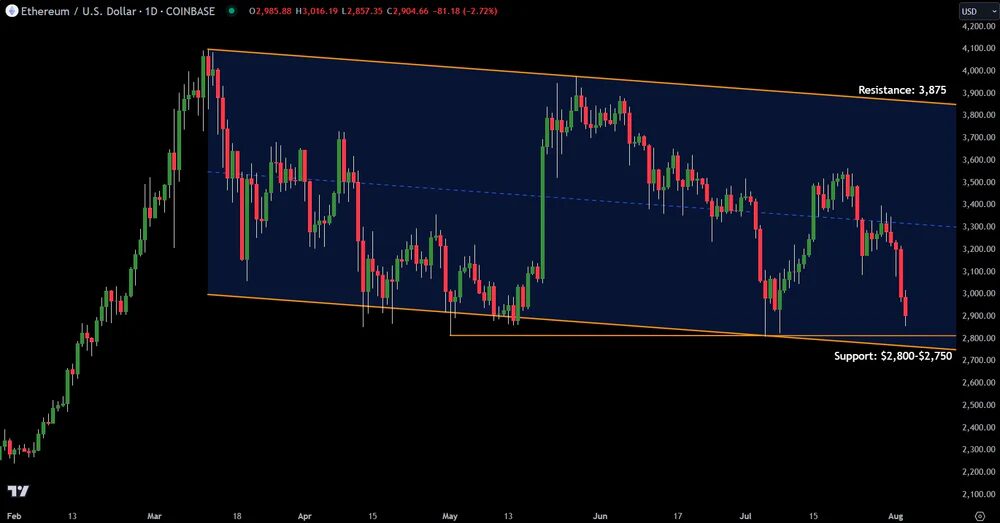
Descending Triangle Breakdown
The descending triangle visible on the daily chart had been compressing ETH price action for several weeks. On Thursday, price decisively broke below the horizontal $2,800 support, validating the bearish pattern.
The immediate downside target is $2,500, which aligns with:
- A historical demand zone
- The 200-week simple moving average (SMA), a key long-term trend indicator watched by institutional investors
Measured Move Targets
If bearish momentum continues, the full height of the triangle projects a downside target near $2,150. This would represent roughly a 20–22% decline from current levels.
Veteran trader Peter Brandt has echoed this concern, noting that ETH/USD has also broken below the lower boundary of a symmetrical triangle. In his view, “the burden of proof is now on the bulls,” with downside risk clearly dominating unless a swift recovery occurs.
RSI Confirms Bearish Divergence
The Relative Strength Index (RSI) has dropped sharply from 68 in early January to around 34, signaling a significant loss of upward momentum. This bearish divergence indicates that even during previous price rallies, buying pressure had been weakening beneath the surface.
3. On-Chain Data Mirrors Early Bear Market Conditions
Beyond technical charts, on-chain data paints a similarly cautious picture.
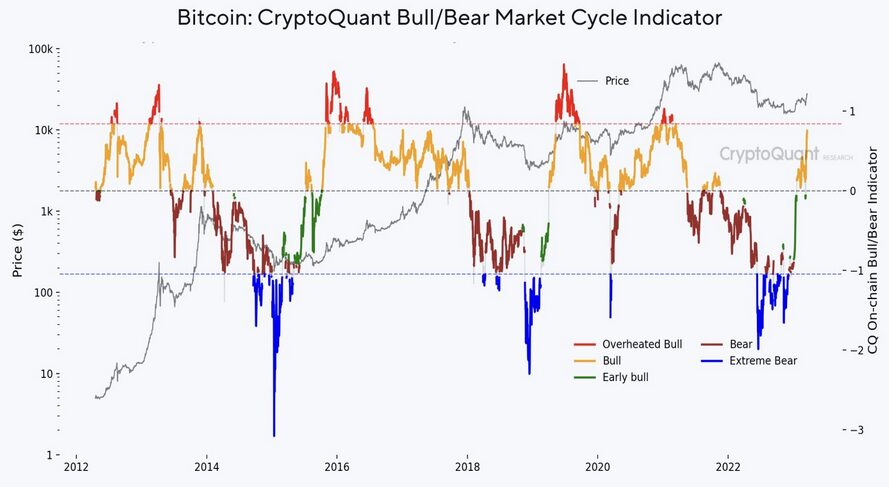
NUPL Enters the “Fear Zone”
Ethereum’s Net Unrealized Profit/Loss (NUPL) metric has shifted from the “Anxiety” (yellow) zone into the “Fear” (orange) zone. Historically, this transition has often coincided with the early stages of prolonged bear markets.
NUPL measures the difference between unrealized profits and unrealized losses held by market participants. When it enters the fear zone, it suggests that a growing share of investors are holding ETH at a loss — a psychological environment that tends to suppress speculative demand.
In past cycles, including 2018 and 2022, ETH’s entry into the fear zone was followed by extended periods of price compression and downward drift.
Moving Average Crossovers Signal Structural Weakness
Another notable signal is the behavior of Ethereum’s 111-day moving average relative to the 200-day moving average. The 111-day MA has remained below the 200-day MA, a configuration that historically preceded deeper corrections during previous bear markets.
While moving averages are lagging indicators, their alignment reinforces the idea that Ethereum’s current weakness is not isolated but part of a broader structural shift.
4. Macro and Ecosystem Context: Why Ethereum Is Especially Vulnerable Now
Ethereum’s price action cannot be analyzed in isolation. Several broader factors amplify downside risk:
- Tighter global liquidity: Higher interest rates reduce speculative capital flows into crypto.
- Rotation toward Bitcoin: In uncertain environments, capital often rotates from altcoins into Bitcoin.
- Layer-2 fragmentation: While scaling solutions improve Ethereum usability, they also disperse fee revenue and narrative clarity.
At the same time, Ethereum continues to face competitive pressure from alternative smart contract platforms offering lower fees and faster settlement. While Ethereum’s security and decentralization remain unmatched, markets often discount long-term fundamentals during risk-off phases.
5. What This Means for Investors Seeking the “Next Opportunity”
For readers focused on discovering new crypto assets or future income streams, Ethereum’s downturn is not purely negative — but it does demand strategic clarity.
Short-Term Traders
For short-term traders, the current environment favors caution. Volatility may increase, but directional conviction is weak until ETH either:
- Reclaims $2,800 decisively, or
- Finds strong support and consolidation near $2,500
Long-Term Investors
Long-term investors often view fear-driven phases as accumulation opportunities. Historically, Ethereum purchases made near the 200-week SMA have delivered favorable risk-adjusted returns — provided investors can tolerate drawdowns and long holding periods.
Builders and Operators
For blockchain builders, lower asset prices often coincide with:
- Reduced hype
- Lower operational costs
- More focused development environments
Many of Ethereum’s most important infrastructure upgrades and DeFi innovations were built during previous bear markets.
6. Strategic Outlook: Risk Management Over Prediction
The most important takeaway is not whether Ethereum will hit $2,500 or $2,100, but how market participants manage uncertainty.
Rather than predicting exact price levels, experienced investors and operators focus on:
- Position sizing
- Liquidity management
- Scenario planning
Ethereum remains a foundational layer for decentralized finance, stablecoins, NFTs, and institutional blockchain experimentation. Short-term price weakness does not negate its long-term relevance — but it does reset expectations.
Final Conclusion: A Test of Conviction and Strategy
Ethereum’s breakdown below $2,800 marks a critical juncture. Technical patterns, momentum indicators, and on-chain data all suggest that downside risk toward $2,500 — and potentially lower — cannot be ignored.
Yet history shows that periods of fear often lay the groundwork for the next wave of innovation and value creation. For those seeking the next crypto opportunity or practical blockchain use cases, this phase is less about panic and more about preparation.
In markets like these, patience, discipline, and strategic thinking matter far more than optimism alone.