Key Takeaways :
- The Bitcoin-to-gold (BTC/XAU) ratio has deviated from its long-term power-law trend for the first time on record.
- Gold’s surge beyond $5,000 has distorted traditional BTC bottom-detection signals.
- Macro forces—not crypto-native cycles—are dominating price behavior in early 2026.
- The historical “four-year Bitcoin cycle” is increasingly questioned by institutional analysts.
- A gold correction later in 2026 could reopen upside scenarios for Bitcoin beyond $140,000.
1. Why the Bitcoin-to-Gold Ratio Has Long Mattered
For over a decade, Bitcoin traders and macro-oriented investors have relied on the Bitcoin-to-gold ratio (BTC/XAU) as a critical relative-value indicator. Rather than focusing solely on Bitcoin’s USD-denominated price, this ratio compares Bitcoin’s purchasing power against gold—the world’s most established monetary hedge.
Historically, major Bitcoin cycle bottoms have coincided with extreme undervaluation versus gold. When Bitcoin weakened relative to gold, it often marked periods of macro stress, liquidity contraction, or risk aversion—conditions that eventually set the stage for powerful Bitcoin recoveries once risk appetite returned.
This framework worked particularly well in prior cycles, where Bitcoin’s price behavior followed relatively clean four-year halving-driven patterns. However, as 2026 begins, cracks are appearing in this once-reliable signal.
2. A Historic Deviation From the Power-Law Model
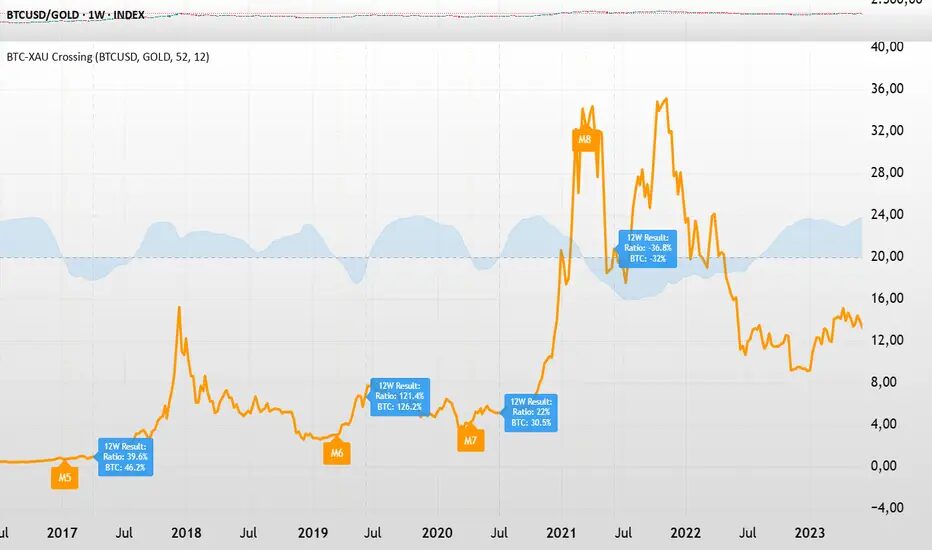
Analyst Julius recently highlighted a development that may prove structurally important: the BTC/XAU ratio has, for the first time, clearly deviated from its long-term power-law trend.
The power-law model is often used by long-term Bitcoin analysts to describe Bitcoin’s growth trajectory over time. While not a predictive oracle, it has historically served as a useful valuation envelope. Prices far above the curve suggested speculative excess, while deep deviations below implied long-term undervaluation.
As of January 2026, BTC/XAU fell to its most undervalued level relative to this power-law band. This coincided with gold breaking above $5,000 per ounce—a historic milestone driven by a confluence of macro risks, including geopolitical instability, concerns over U.S. government shutdowns, and aggressive reserve diversification by central banks.
What makes this episode different is not just the depth of the deviation—but its persistence.
3. Gold’s Supercycle Is Distorting Crypto Signals
Gold’s rally is not a marginal move. Major financial institutions are openly forecasting further upside. Bank of America recently projected gold prices exceeding $6,000 before the end of 2026, citing structural demand from sovereign buyers and long-term inflation hedging.
This matters because BTC/XAU is a relative metric. Even if Bitcoin remains fundamentally strong, an unusually aggressive gold rally mechanically suppresses the ratio. In other words, Bitcoin can appear “weak” versus gold even without catastrophic crypto-specific developments.
This creates a dangerous interpretive trap for traders relying on historical BTC/XAU fractals. What previously signaled a cyclical Bitcoin bottom may now reflect a gold-driven distortion rather than a true crypto capitulation.
4. Questioning the Four-Year Bitcoin Cycle
At the same time, confidence in Bitcoin’s traditional four-year cycle is eroding.
Several market analyses now suggest that Bitcoin may have peaked near $126,200 in October 2025. Under bearish scenarios, Bitcoin could dip below $50,000 in the coming months—levels that would have been unthinkable just a year earlier.
Unlike prior bear markets driven by crypto-native excess (ICO bubbles, leverage cascades, or exchange collapses), this downturn is unfolding amid broader macro tightening and a renewed preference for defensive assets.
This distinction matters. If Bitcoin is no longer primarily governed by halving cycles, but instead by global liquidity and macro capital flows, then legacy indicators like BTC/XAU may need reinterpretation rather than blind trust.
5. Technical Levels: The 200-2 Week EMA Under Pressure
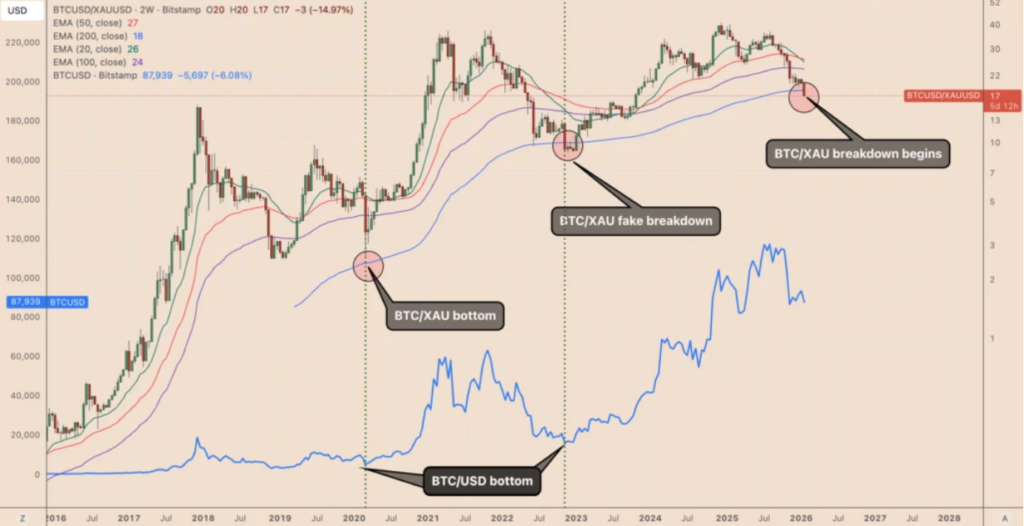
One technical level closely watched by analysts is the 200-period, two-week exponential moving average (200-2W EMA), sometimes referred to as the “blue wave.”
Historically, Bitcoin cycle bottoms have aligned closely with this level when measured against gold. In 2022, BTC/XAU briefly dipped below the EMA before reclaiming it within two months—a classic “false breakdown” that preceded a recovery.
In 2026, however, BTC/XAU is already trading below this EMA, and macro headwinds remain strong. This raises the risk that the historical bottoming fractal may fail entirely.
If BTC/XAU continues to weaken, it would suggest that Bitcoin is losing relative ground not just temporarily, but structurally—at least until macro conditions shift.
6. Macro Forces That Could Flip the Narrative
Despite the bearish signals, not all outlooks are grim.
Citi has cautioned that gold’s rally may lose momentum in the second half of 2026 if U.S. real yields rise, the dollar stabilizes, and risk appetite returns. Under such conditions, capital could rotate out of defensive assets and back into growth-oriented instruments—including Bitcoin.
If gold enters a consolidation or correction phase, pressure on the BTC/XAU ratio would ease significantly. In that scenario, Bitcoin’s upside narratives—scarcity, programmability, global settlement, and institutional adoption—could regain prominence.
This is why institutions such as Standard Chartered continue to maintain long-term Bitcoin price targets above $140,000, contingent on macro normalization rather than speculative excess.
7. What This Means for Investors and Builders
For investors seeking new crypto assets or yield opportunities, the key lesson is nuance. The BTC/XAU ratio is not “broken,” but it is no longer a standalone signal.
Bitcoin is increasingly behaving like a macro-sensitive asset, influenced by real rates, sovereign behavior, and capital flows across asset classes. Gold, meanwhile, is undergoing its own structural repricing.
For builders and operators exploring practical blockchain applications—payments, settlement layers, tokenized assets—this environment may actually be constructive. Periods of price compression often coincide with infrastructure maturation and institutional onboarding.
8. Conclusion: A Signal in Transition, Not in Ruins
The abnormal behavior of the Bitcoin-to-gold ratio in early 2026 does not necessarily signal Bitcoin’s failure—but it does mark the end of a simpler analytical era.
What once functioned as a clean bottom-detection tool must now be contextualized within a complex macro landscape. Gold’s supercycle, shifting monetary regimes, and Bitcoin’s maturation as a global asset are rewriting old playbooks.
For those willing to adapt, this transition may offer not just risk—but opportunity.