Main Points :
- Bitcoin, Ether, XRP, and Solana are all at critical technical inflection points, where the balance between bearish pressure and potential trend reversal is being tested.
- Moving averages and RSI indicators suggest bears still hold short-term control, but defined breakout levels could trigger rapid bullish continuation.
- The broader crypto market is increasingly influenced by institutional flows, ETF expectations, macro liquidity, and ecosystem fundamentals, not purely technical signals.
- For investors seeking new digital assets and yield opportunities, understanding these turning points is essential for both risk management and opportunity capture.
Executive Summary
The cryptocurrency market is once again approaching a decisive moment. After a prolonged period of consolidation and corrective price action, major digital assets such as Bitcoin, Ether, XRP, and Solana are testing key technical levels that may determine whether the market resumes a bullish trend or enters a deeper corrective phase.
This article expands upon the original technical chart analysis by integrating broader market developments: institutional adoption, macroeconomic liquidity cycles, ETF-related capital flows, and the evolving utility of blockchain ecosystems. By combining price structure analysis with fundamental context, we aim to provide readers with a practical framework for identifying emerging opportunities in digital assets—whether for trading, long-term investment, or real-world blockchain applications.
Bitcoin (BTC) Price Outlook: A Battle at the Trend Boundary
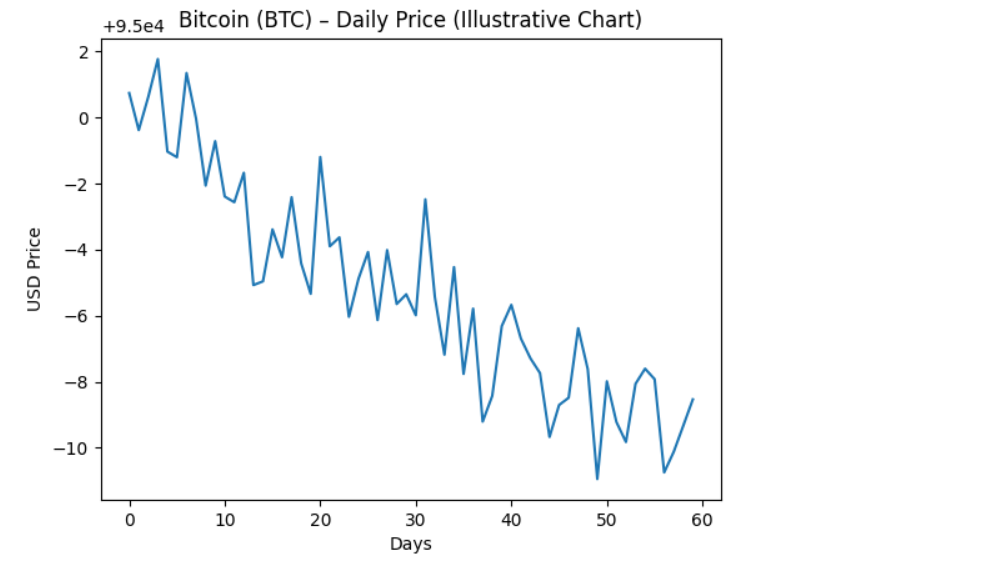
Bitcoin remains the bellwether of the crypto market, and its current structure reflects a delicate tug-of-war between bulls and bears.
Technical Structure
On the daily chart, Bitcoin’s 20-day exponential moving average (EMA) at approximately $91,786 is trending downward. The Relative Strength Index (RSI) remains in negative territory, signaling that bearish momentum still slightly outweighs bullish demand.
- Key Support Zone: $86,500
A decisive breakdown below this level opens the door toward $84,000, where historical buying interest may re-emerge. - Resistance Levels:
- $94,789
- $97,924 (critical breakout level)
If Bitcoin manages to close above $97,924, it would represent a meaningful shift in market structure. Such a move could invalidate the current bearish bias and set the stage for a rally toward $100,000, followed by an extension toward $107,500.
Broader Context
Beyond technicals, Bitcoin’s medium-term outlook is increasingly shaped by institutional dynamics. Spot ETF anticipation, sovereign treasury discussions, and the role of Bitcoin as a macro hedge against currency debasement continue to support long-term demand. However, in the short term, price action remains highly sensitive to liquidity conditions and derivatives positioning.
Ether (ETH) Price Outlook: Compression Before Expansion?
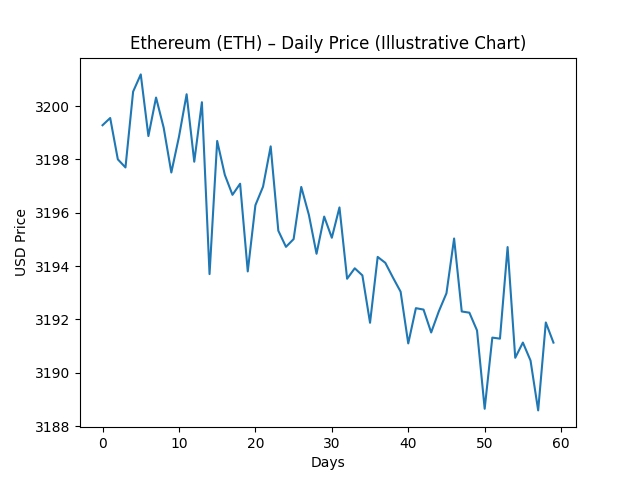
Ethereum currently reflects a state of structural compression, as price action tightens within a symmetrical triangle.
Technical Structure
Ether recently dropped below its moving averages and tested the support line of the symmetrical triangle.
- Downside Risk:
A breakdown below the triangle support could push ETH toward $2,623, marking a deeper corrective phase. - Bullish Recovery Requirement:
Bulls must quickly reclaim the moving averages and secure a daily close above resistance to restore upward momentum.
Weak rebound attempts so far suggest that sellers remain active on rallies, but the longer ETH holds within the triangle, the higher the probability of a volatility expansion event—often resulting in a sharp directional move.
Broader Context
Ethereum’s fundamentals remain closely tied to:
- Layer-2 scaling adoption
- Restaking and staking yield dynamics
- Institutional experimentation with tokenized real-world assets (RWAs)
A technical breakout aligned with positive ecosystem developments could rapidly restore ETH’s leadership role in the market.
XRP Price Outlook: Defensive Posture Within a Descending Channel
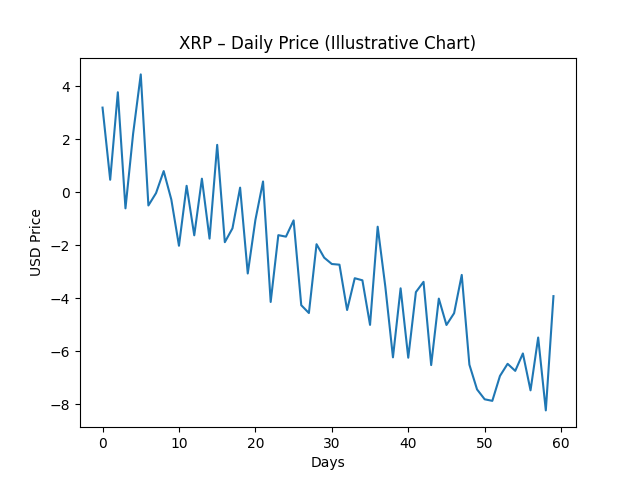
XRP continues to trade below its moving averages, confirming persistent bearish pressure.
Technical Structure
- Immediate Targets for Bears:
- $1.77
- $1.61 (major structural support)
- Support Zone:
Between $1.61 and the descending channel support line, where buyers are expected to defend aggressively.
If XRP rebounds sharply from this zone, it may continue to trade sideways within the descending channel. However, such price action would still represent consolidation rather than trend reversal.
Bullish Scenario
A decisive push above the descending trendline would be a strong signal that buyers have regained control. In this case, XRP could advance toward $2.70, re-establishing bullish momentum.
Broader Context
XRP’s market behavior remains influenced by:
- Regulatory clarity expectations
- Cross-border payment use cases
- Institutional adoption narratives in settlement infrastructure
Solana (SOL) Price Outlook: Range-Bound or Trend Reversal?
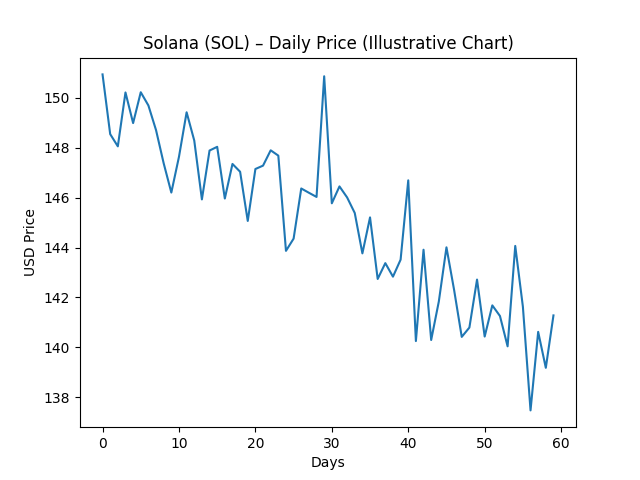
Solana has slipped below its 50-day simple moving average (SMA) at $132, increasing the likelihood of short-term range-bound trading.
Technical Structure
- Likely Range: $117 – $147
- Critical Support: $117
A breakdown below this level could restart a bearish trend, targeting $95. - Bullish Breakout Level:
A daily close above $147 would signal bullish dominance and potential trend reversal.
If such a breakout occurs, SOL could rally toward $172, with a further extension to $189 under strong momentum.
Broader Context
Solana’s appeal lies in:
- High-throughput performance
- Expanding DeFi and NFT ecosystems
- Growing interest from consumer-facing blockchain applications
These fundamentals provide a strong narrative backdrop, but technical confirmation remains essential.
Market Implications for Investors and Builders
For readers seeking new crypto assets, yield opportunities, or practical blockchain use cases, the current market environment offers both risk and opportunity.
- Traders should focus on breakout confirmation and volume expansion.
- Long-term investors may view pullbacks into major support zones as strategic accumulation opportunities.
- Builders and institutions should monitor how price trends align with ecosystem adoption and real-world utility.
Conclusion: A Market at the Edge of Decision
The cryptocurrency market stands at a pivotal juncture. Bitcoin, Ether, XRP, and Solana are all testing structural levels that could define the next major trend. While bearish pressure remains evident in the short term, clearly defined resistance breakouts could trigger a renewed bullish phase across the market.
For participants seeking the next wave of opportunity in digital assets, this is not merely a moment to observe—but a moment to prepare. Understanding these technical thresholds, combined with macro and ecosystem awareness, will be crucial in navigating the next chapter of the crypto market.