Key Takeaways :
- Bitcoin is showing a rare alignment of technical breakouts and improving on-chain fundamentals, supporting a potential move toward $107,000.
- A confirmed ascending triangle breakout and an approaching golden cross suggest trend continuation rather than a speculative spike.
- Selling pressure from long-term holders—especially coins dormant for over five years—has materially declined.
- Net Bitcoin outflows from exchanges indicate tightening supply dynamics.
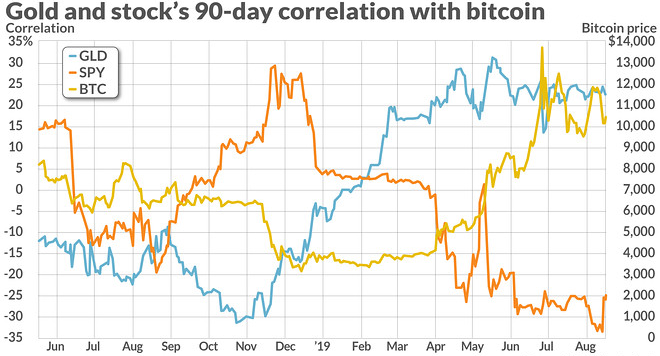
- A historically significant inverse correlation between Bitcoin and gold may once again favor a strong Bitcoin rally amid global liquidity expansion.
1. Bitcoin at a Critical Juncture: Beyond Psychological Resistance
Bitcoin (BTC) is once again approaching a decisive moment in its long-term market structure. After months of consolidation and repeated failures to hold above the $100,000 level, recent price action suggests that the market may be preparing for a more sustainable breakout. Unlike previous attempts driven largely by speculative momentum, the current setup reflects a convergence of technical validation, on-chain supply dynamics, and macroeconomic tailwinds.
The central question is no longer whether Bitcoin can momentarily touch six figures, but whether it can reclaim $100,000 as a durable support zone and extend toward the technically derived target of approximately $107,000. Such a move would not only reinforce Bitcoin’s role as a macro asset but also reshape capital allocation strategies across the broader digital asset ecosystem.
2. Ascending Triangle Breakout: A Textbook Technical Signal
Over the past several weeks, Bitcoin formed a well-defined ascending triangle pattern on the daily chart. This structure—characterized by higher lows pressing against a relatively flat resistance—typically reflects increasing buyer aggression and a gradual absorption of sell-side liquidity.
BTC/USD daily chart – Ascending triangle breakout and retest
The breakout above the $95,000 resistance level was followed by a controlled pullback, during which former resistance was successfully retested as support. This behavior is critical. Failed breakouts often collapse quickly below the prior range, while legitimate breakouts tend to retest and hold. Bitcoin’s ability to rebound from this retest strongly suggests that the breakout is structurally sound rather than a false signal.
Using classical technical measurement, the maximum height of the triangle projected from the breakout point yields a target near $107,000. If the current support zone remains intact, this level becomes a natural magnet for price action in the coming weeks.
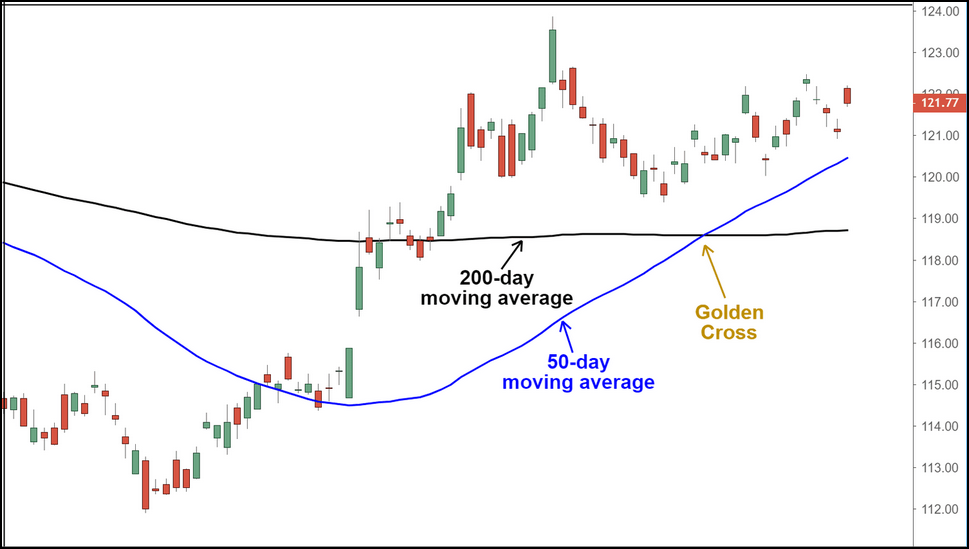
3. The Approaching Golden Cross: Reinforcing Trend Continuity
Simultaneously, the daily chart shows the 20-day exponential moving average (EMA) converging toward a bullish crossover with the 50-day EMA. This “golden cross” formation is widely regarded as a medium-term trend confirmation signal rather than a short-term trading trigger.
Historically, Bitcoin’s golden crosses have coincided with sustained uptrends rather than isolated rallies. In the most recent comparable instance, Bitcoin advanced approximately 17% within one month of the signal’s confirmation. While past performance does not guarantee future results, the repetition of similar structural conditions increases the probability of trend continuation.
Importantly, this signal is emerging after a prolonged consolidation phase rather than after an overheated vertical rally. That context significantly improves its reliability.
4. Long-Term Holder Behavior: The Quiet Shift That Matters Most
Technical signals alone rarely sustain a multi-month advance without underlying changes in supply behavior. In this cycle, the most consequential development may be the sharp decline in selling pressure from long-term Bitcoin holders.
On-chain data tracking UTXO consumption from coins dormant for more than five years reveals a clear deceleration in distribution. At the start of the current cycle, long-term holders were realizing profits at an unusually aggressive pace, with 90-day average consumption approaching 2,300 BTC. Since then, this figure has fallen to roughly 1,000 BTC.
Spent output from long-term holders (>5 years dormant)
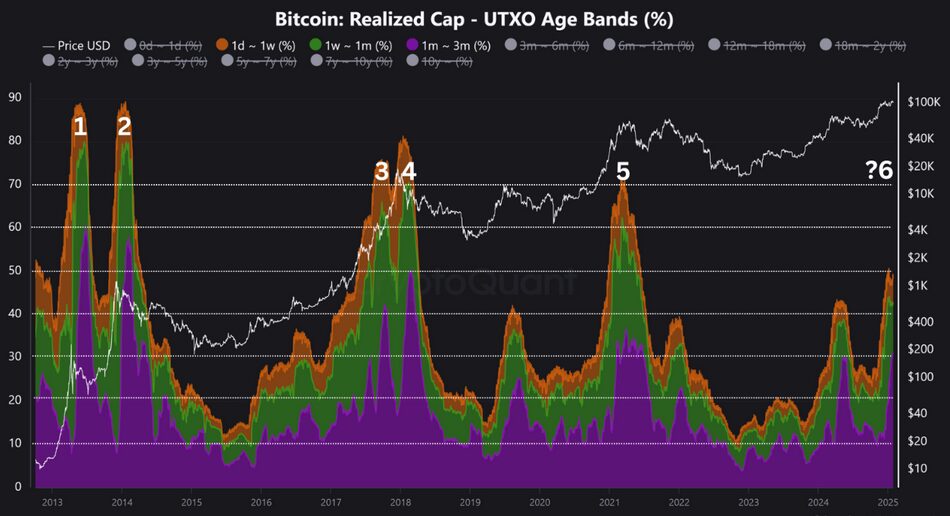
This shift suggests that the majority of strategic profit-taking by early holders has already occurred. As distribution slows, newly issued demand—particularly from institutional channels—faces a shrinking pool of available supply.
An analyst known as Darkfrost summarized this transition succinctly: the market has moved from a phase dominated by distribution to one increasingly characterized by renewed accumulation among long-term participants.
5. Exchange Outflows and Supply Tightening
The reduction in long-term holder selling aligns with another critical metric: net Bitcoin flows to and from exchanges. Since December 2024, Bitcoin has experienced its largest net exchange outflow in over a year.
BTC net transfer volume from and to exchanges
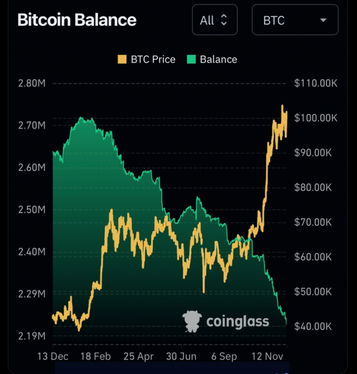
Net outflows typically indicate that investors are moving assets into cold storage or custodial solutions designed for long-term holding rather than preparing to sell. In practical terms, this reduces immediately available liquidity on the sell side, amplifying the impact of incremental demand.
When combined with declining issuance growth post-halving and persistent ETF inflows, this dynamic creates a structurally tight supply environment—one that historically precedes sharp upward repricing.
6. Bitcoin and Gold: A Counterintuitive but Powerful Relationship
From a macro perspective, Bitcoin’s relationship with gold provides an additional layer of context. Periods in which Bitcoin and gold exhibit negative correlation have historically preceded strong Bitcoin rallies, often within a two-month window.
On average, such episodes have been followed by gains of approximately 56%, with only one major exception in mid-2021. That anomaly coincided with extraordinary external shocks, including China’s mining ban and forced deleveraging across crypto markets.
BTC/USD weekly chart compared with gold correlation
In the current environment, the macro backdrop appears more supportive than during that exception. Global liquidity measures are expanding, and the U.S. Federal Reserve is widely expected to conclude its quantitative tightening cycle. These conditions historically favor scarce, non-sovereign assets—particularly those with high convexity to liquidity expansion.
7. Liquidity Expansion and the Institutional Lens
Industry participants increasingly frame Bitcoin’s bull cycles through the lens of global M2 money supply growth. According to Matt Hougan of Bitwise, Bitcoin’s strongest historical advances have aligned closely with periods of accelerating global liquidity.
As capital seeks alternatives to debasing fiat currencies and low-yield sovereign debt, Bitcoin’s digital scarcity and growing institutional infrastructure position it as both a hedge and a speculative growth asset. In this context, Bitcoin’s upside is not merely a function of retail enthusiasm but of strategic portfolio reallocation.
For investors exploring new crypto assets and revenue opportunities, this environment also has second-order effects. As Bitcoin stabilizes at higher levels, risk appetite often cascades into infrastructure tokens, layer-2 ecosystems, and yield-generating protocols built around Bitcoin liquidity itself.
8. Toward $107,000: A Realistic Scenario, Not a Fantasy
Taken together, the current constellation of factors—technical breakouts, reduced long-term selling, exchange outflows, and favorable macro correlations—suggests that a move toward $107,000 is not merely speculative optimism. It represents a technically and fundamentally defensible scenario.
Crucially, the market no longer appears dependent on aggressive leverage or euphoric sentiment to sustain upward momentum. Instead, it reflects a quieter but more resilient foundation, one that aligns with Bitcoin’s maturation as a macro-relevant asset class.
Conclusion: A Structural Shift Worth Watching
Bitcoin’s attempt to reclaim $100,000 and advance toward $107,000 comes at a time when its internal and external dynamics are unusually aligned. The retreat of long-term holder selling pressure marks a subtle but powerful transition from distribution to accumulation. Combined with tightening exchange supply and improving macro liquidity conditions, this shift creates a landscape in which higher prices can be sustained rather than fleeting.
For readers seeking not just price appreciation but practical insight into how digital assets function within broader financial systems, this moment offers a compelling case study. Bitcoin is increasingly behaving less like a speculative anomaly and more like a structurally integrated asset—one whose movements are shaped by liquidity, supply discipline, and institutional behavior as much as by charts.
Whether or not $107,000 is reached in the near term, the path Bitcoin is currently tracing suggests that its next phase will be defined less by hype and more by structure. That, in itself, may be the most bullish signal of all.