Main Points :
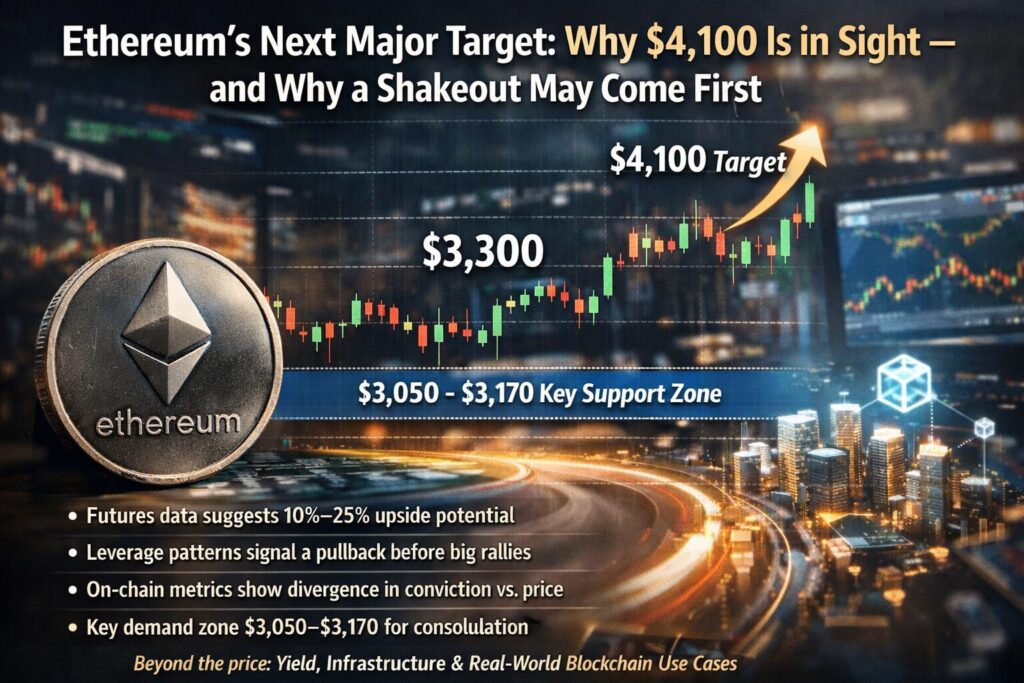
- Ethereum (ETH) is trading around $3,300, with futures market data suggesting 10%–25% upside potential
- Historical leverage patterns indicate that short-term pullbacks often precede strong rallies
- On-chain indicators show a temporary divergence between price performance and holder conviction
- A key demand zone between $3,050–$3,170 could act as a final consolidation area before a move toward $4,100
- For investors and builders, ETH’s structure highlights opportunities beyond price speculation, including yield, infrastructure, and real-world blockchain use cases
1. Ethereum at a Critical Juncture
Ethereum is once again at the center of market attention. Trading near $3,300, ETH has reclaimed levels not seen since late 2025, reigniting speculation about whether a sustained move toward $4,100 is imminent.
From a macro perspective, Ethereum’s recovery has been driven by a combination of renewed risk appetite, increasing derivatives activity, and expectations that ETH will continue to outperform many alternative Layer-1 networks in terms of liquidity depth and real-world adoption.
However, this rally is not without friction. Historical data suggests that Ethereum rarely enters extended bullish phases without first undergoing a leverage reset — a brief but often sharp pullback that clears excessive speculative positioning.
For market participants, understanding this dynamic is essential not only for timing entries, but also for identifying how Ethereum’s ecosystem can be leveraged as a revenue-generating infrastructure, rather than merely a speculative asset.
2. Leverage Dynamics: Why Pullbacks Often Strengthen the Trend
A recurring pattern in Ethereum’s market structure has been identified by multiple derivatives analysts, including those closely monitoring activity on Binance.
When ETH leverage ratios rise faster than spot prices, the market tends to become vulnerable to liquidation-driven corrections. These corrections are typically not trend reversals, but mechanical resets caused by overextended long positions.
Historical Precedent
Throughout 2025, this pattern appeared repeatedly:
- February: Leverage spike → sharp pullback → renewed rally
- April: Similar leverage expansion followed by liquidation
- September & November: Rapid leverage increases preceded brief but violent dips, after which price continued higher
In each case, Ethereum emerged stronger after speculative excess was removed.
At present, ETH’s leverage ratio sits near 0.60, which is historically elevated. Crucially, leverage has not declined despite recent price gains. This suggests that risk appetite remains strong, but also increases the probability of a short-term flush.
Implication for Investors
Rather than viewing such pullbacks as bearish signals, experienced market participants often interpret them as constructive events — opportunities where liquidity is redistributed from overleveraged traders to longer-term holders.
Ethereum leverage ratio on Binance and subsequent price reactions
3. Futures Market Signals: 10%–25% Upside Still on the Table
Despite the risk of a near-term correction, futures market data continues to imply meaningful upside potential for ETH.
If Ethereum were to move 10%–25% higher from current levels, the price would land between $3,630 and $4,125, placing $4,100 squarely within a statistically reasonable target zone.
This projection is not based on sentiment alone, but on:
- Open interest expansion without panic unwinding
- Stable funding rates relative to historical bull phases
- Absence of long-term distribution signals from large holders
These factors suggest that even if a pullback occurs, it is more likely to serve as a launchpad rather than a ceiling.
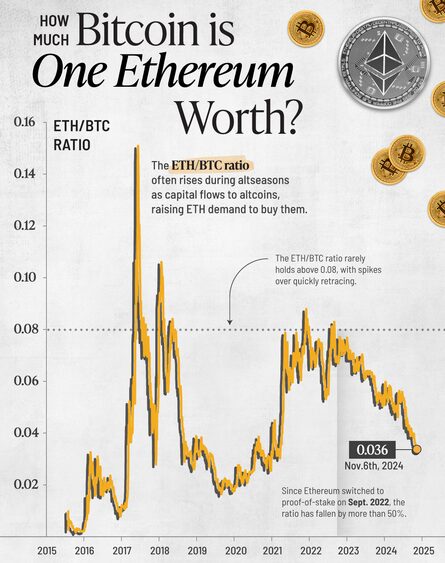
4. On-Chain Divergence: SOPR Signals a Confidence Gap
While derivatives markets remain optimistic, on-chain data paints a more nuanced picture.
According to analysts at Glassnode, Ethereum’s Spent Output Profit Ratio (SOPR) has remained below 1, even as ETH has outperformed Bitcoin since January’s lows.
What SOPR < 1 Means
- A SOPR below 1 indicates that, on average, coins being spent are realized at a loss
- This suggests that many ETH holders are not yet confident enough to take profits
- In contrast, Bitcoin’s SOPR has recovered above 1, indicating stronger holder conviction
This divergence implies that Ethereum’s rally may still be in a relatively early stage, where skepticism persists despite improving price action.
From a contrarian standpoint, this lack of euphoria can actually be supportive of further upside.
Comparison of SOPR between Ethereum and Bitcoin
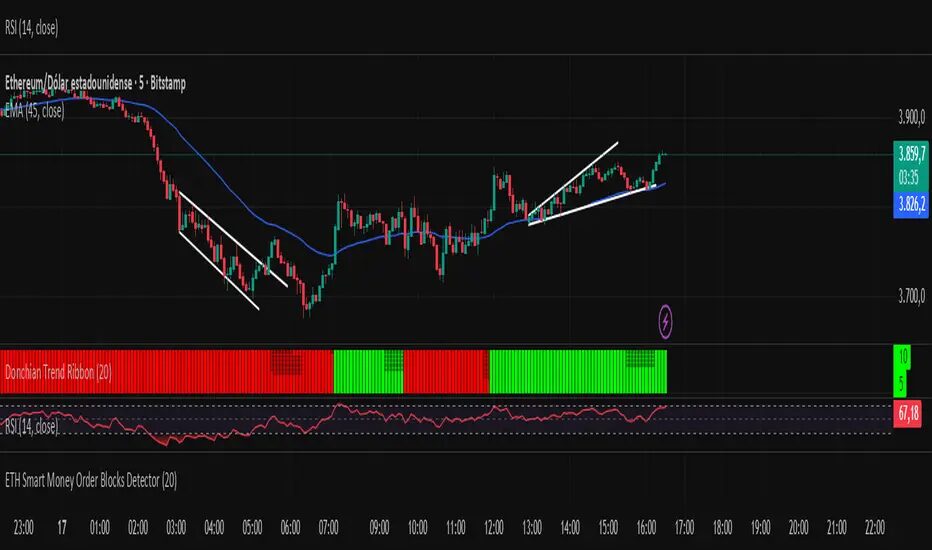
5. Technical Structure: The $3,050–$3,170 “Fair Value” Zone
From a technical perspective, Ethereum has recently printed a daily close near $3,324, its highest since November 12, 2025.
However, volume profile analysis reveals a critical zone below current prices.
Between $3,050 and $3,170, several factors converge:
- A major order block formed during the recent rally
- The Visible Range Volume Profile (VRVP) control point since September 2025
- A historical equilibrium area where buyers and sellers previously agreed on value
This zone represents what many traders refer to as “fair value” — a price region that tends to attract price revisits before major expansions.
Ethereum daily chart highlighting order block and VRVP control point
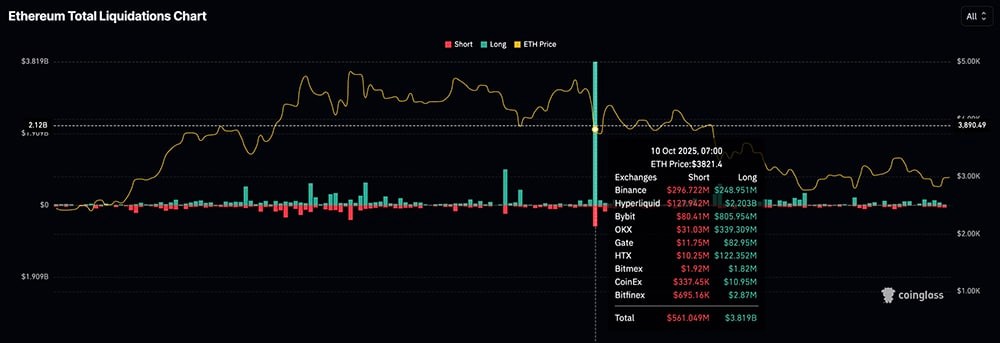
6. Liquidity Concentration: Why a Shakeout Could Be Brief
Data from derivatives positioning further reinforces the likelihood of a controlled pullback rather than a deep correction.
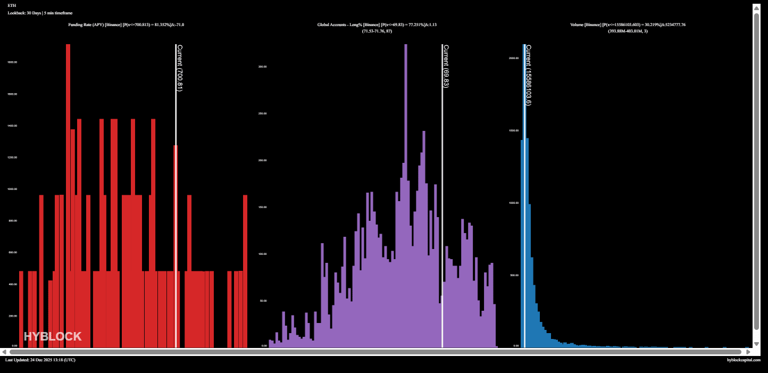
According to Hyblock Capital, more than $500 million in net long positions are concentrated between $3,040 and $3,100. Such dense positioning often acts as a magnet for price, as markets naturally seek to test areas of high liquidity.
If price dips into this range:
- Overleveraged longs may be liquidated
- Stronger hands may absorb supply
- The resulting structure can support a more sustainable advance toward $4,100
In this sense, a short-term decline may actually be the final prerequisite for a healthier rally.
Concentration of net long positions in the $3,040–$3,100 range
7. Beyond Price: What This Means for Practical Blockchain Use
For readers interested in practical blockchain applications, Ethereum’s current setup carries implications beyond trading.
A stable move toward higher price levels often coincides with:
- Increased staking participation and yield strategies
- Expansion of Layer-2 ecosystems seeking cheaper execution
- Renewed institutional interest in ETH-denominated settlement and collateral
For builders and operators, volatility-driven pullbacks can provide opportunities to accumulate ETH for operational use, such as liquidity provisioning, gas cost management, or collateralization strategies.
8. Conclusion: $4,100 Is Plausible — but Patience May Be Required
Ethereum’s market structure suggests that $4,100 is a realistic medium-term target, supported by futures positioning, historical leverage behavior, and technical projections.
At the same time, elevated leverage and concentrated liquidity zones make a short-term pullback not only possible, but arguably healthy.
For investors, this means distinguishing between noise and structure. For entrepreneurs and blockchain practitioners, it underscores Ethereum’s continued relevance as both a financial asset and a programmable settlement layer.
If history rhymes, Ethereum’s next major move higher may begin after the market tests its conviction — not before.