
Main Points :
- Bitcoin’s 52-week correlation with gold has dropped to zero for the first time since mid-2022, with a shift into negative territory likely.
- Historically, periods when Bitcoin becomes negatively correlated with gold have preceded major Bitcoin rallies, averaging a 56% gain within roughly two months.
- The only major exception occurred in May 2021, when extraordinary regulatory and corporate shocks overwhelmed historical signals.
- Current macro conditions—global liquidity expansion, rising global M2, and the expected end of the Federal Reserve’s quantitative tightening—are broadly supportive for Bitcoin.
- Long-term fractal analysis suggests Bitcoin’s current structure closely resembles the 2020–2021 pre-parabolic phase, implying potential upside toward the $144,000–$150,000 range.
- While gold has recently outperformed, several analysts expect Bitcoin to reclaim leadership as global monetary easing accelerates.
1. Bitcoin and Gold: From Safe-Haven Companions to Temporary Strangers
For much of the past decade, Bitcoin and gold have frequently been discussed in the same breath. Both assets are often framed as hedges against inflation, monetary debasement, and systemic financial risk. This narrative has driven periods of positive correlation, particularly during times of macroeconomic stress.
However, correlation is not destiny. According to recent market data, Bitcoin’s 52-week correlation with gold has fallen to zero for the first time since mid-2022. If current trends persist, this relationship could soon turn negative by the end of January. For seasoned market observers, this development is not merely a statistical curiosity—it is a potential signal.
Correlation shifts matter because they often reflect changing investor behavior. When Bitcoin decouples from gold, it suggests that market participants are no longer treating BTC purely as “digital gold.” Instead, Bitcoin begins to trade more like a high-beta monetary asset—one that reacts aggressively to changes in global liquidity, risk appetite, and capital flows.
2. Historical Patterns: What Happened the Last Four Times?
Looking back over Bitcoin’s trading history, there have been four notable periods when its correlation with gold turned negative after hovering around zero. In each of these cases—except one—Bitcoin entered a powerful rally shortly thereafter.
On average, BTC appreciated by approximately 56% within two months following the shift into negative correlation. These rallies were not subtle; they represented decisive transitions from consolidation to expansion phases.
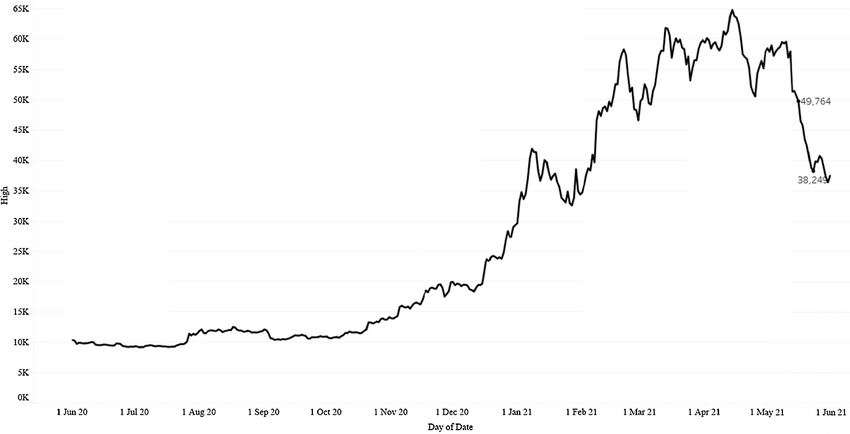
The 2021 Exception
The lone exception occurred in May 2021. Instead of rallying, Bitcoin fell roughly 26%. This breakdown, however, coincided with extraordinary external shocks:
- A major electric vehicle manufacturer halted Bitcoin payments, undermining institutional confidence.
- Chinese authorities intensified crackdowns on both Bitcoin mining and cryptocurrency trading.
- Forced deleveraging cascaded across crypto markets, overwhelming historical signals.
In other words, the failure of the correlation signal in 2021 was not due to flawed market structure, but rather to unprecedented policy and corporate actions that temporarily rewrote the rules.
Today’s environment looks fundamentally different.
3. The Macro Backdrop: Liquidity Is the Real Catalyst
Bitcoin does not exist in isolation. Its strongest bull markets have consistently coincided with periods of expanding global liquidity. One of the most widely used proxies for this liquidity is global M2 money supply, which aggregates cash, checking deposits, and easily convertible near-money instruments across major economies.
[Chart showing global M2 growth vs Bitcoin year-over-year performance]

Recent data indicates that global M2 growth is accelerating again after a period of contraction. At the same time, expectations are building that the U.S. Federal Reserve is nearing the end of its quantitative tightening (QT) cycle.
According to leading asset managers, Bitcoin bull markets have historically aligned with these liquidity expansions. When money supply grows faster than economic output, excess capital seeks alternative stores of value and speculative assets. Bitcoin, with its fixed supply and global accessibility, is a natural beneficiary.
4. Gold vs. Bitcoin: Competition or Rotation?
In a similar macro environment, gold reportedly delivered gains of around 65% in 2025, while Bitcoin’s performance remained relatively flat. This divergence has raised questions: Has Bitcoin lost its edge? Or is this simply a matter of timing?
Some analysts argue that gold often leads during the early stages of monetary easing, as conservative capital seeks safety. Bitcoin, by contrast, tends to outperform later, once risk appetite expands and liquidity reaches speculative markets.
This view suggests not competition, but rotation. Capital flows first into gold, then into Bitcoin, and eventually into higher-risk crypto assets.
Importantly, long-term data shows that Bitcoin and gold exhibit only a mild positive correlation over extended periods. This loose relationship is not a weakness—it is precisely what makes Bitcoin attractive as a portfolio diversifier.
5. Monetary Expansion and the 2026 Thesis
Several analysts have highlighted accelerating currency issuance as a key tailwind for Bitcoin heading into 2026. With multiple central banks signaling easing cycles and fiscal pressures mounting globally, monetary expansion appears structurally embedded rather than temporary.
From a practical standpoint, this matters for investors and businesses alike:
- For investors, Bitcoin represents asymmetric upside in an environment where fiat purchasing power continues to erode.
- For enterprises, Bitcoin increasingly functions as a treasury diversification tool and a settlement asset in cross-border contexts.
- For blockchain practitioners, renewed bull markets tend to unlock funding, experimentation, and real-world adoption.
If global liquidity growth remains positive through 2026, Bitcoin’s macro foundation looks increasingly solid.
6. Fractal Analysis: Echoes of the 2020–2021 Cycle
Beyond macroeconomics, technical analysts often look for recurring structural patterns, or fractals, in price behavior. One widely cited comparison aligns Bitcoin’s current 2024–2026 structure with the 2020–2021 cycle.
[Chart comparing BTC 2020–2021 cycle with 2024–2026 cycle]
In the earlier cycle, Bitcoin:
- Ended a long-term downtrend
- Entered a multi-month accumulation phase
- Broke out into a parabolic advance toward new all-time highs
Current price action appears to follow a similar roadmap. Analysts suggest that Bitcoin has already exited its accumulation range and is approaching the early stages of a parabolic expansion.
7. Price Targets and Risk Considerations
If the historical average rally of 56% materializes again, Bitcoin could move into the $144,000–$150,000 range. While such targets are not guarantees, they provide a framework for scenario planning.
That said, risks remain:
- Unexpected regulatory actions
- Severe macroeconomic shocks
- Structural failures within crypto infrastructure
Unlike in 2021, however, Bitcoin’s market today is deeper, more institutionally integrated, and supported by regulated investment vehicles. These factors reduce—but do not eliminate—systemic risk.
8. Practical Implications for Crypto-Focused Readers
For readers seeking new crypto assets, revenue opportunities, or practical blockchain use cases, the current environment offers several takeaways:
- Bitcoin’s decoupling from gold may mark the transition from defensive to expansionary market behavior.
- Liquidity-driven rallies tend to lift the entire crypto ecosystem, creating downstream opportunities in infrastructure, payments, and tokenized finance.
- Businesses planning blockchain integration often find the most favorable conditions during early bull phases, when capital and talent re-enter the market.
Conclusion: A Signal Worth Watching, Not Blindly Following
Bitcoin’s zero correlation with gold is not a crystal ball. But history suggests it is a signal worth paying attention to—especially when reinforced by macro liquidity trends and long-term technical structures.
As global monetary conditions tilt toward easing, Bitcoin appears positioned to reassert itself not just as “digital gold,” but as a dynamic monetary asset with unique upside characteristics. Whether or not the $150,000 target is reached, the broader implication is clear: Bitcoin is entering a phase where its behavior may once again surprise those who underestimate its adaptability.