Main Points :
- Bitcoin’s 30-day implied volatility sharply declined, signaling panic exhaustion and the potential for a major volatility squeeze that could trigger a push toward $100,000.
- The U.S. Dollar Index (DXY) enters a renewed downtrend, strengthening the bullish case for BTC due to persistent negative correlation.
- Ethereum shows strong buyer control, supported by a confirmed bear trap and a positive daily MACD histogram.
- XRP forms a strong base at around $2.20, with price stability indicating strong underlying demand.
- Solana approaches a breakout region, where a successful breach could send prices toward $165.
- Broader trend: Institutions continue accumulating BTC and ETH, while volatility metrics across major assets point to a tightening range before a potentially explosive move.
INTRODUCTION: Market Conditions Turning Favorable for Large-Cap Crypto Assets
The cryptocurrency market enters December 2025 with renewed optimism among traders and institutional allocators. Bitcoin, which has fluctuated between $90,000 and $98,000 in recent weeks, is beginning to show strong technical indications that a return to $100,000 may be imminent. Key volatility metrics, correlations with macroeconomic indicators, and structural demand patterns all suggest that a major breakout could be developing beneath the surface.
Meanwhile, Ethereum, XRP, and Solana are each showing distinct but complementary momentum structures. ETH continues to attract bullish interest due to its strengthening technical posture; XRP is forming a strong price floor that could fuel continuation; and Solana’s tightening price structure resembles classic breakout formations.
Before diving into individual assets, a broader theme dominates current market conversations: volatility compression usually precedes trend expansion. This is as relevant to crypto as it is to equities or commodities, and Bitcoin may once again be approaching such a pivotal moment.
SECTION 1: Bitcoin’s Volatility Compression and the Return of the $100,000 Target
1-1. The BVIV Index Signals Panic Exhaustion
Bitcoin’s 30-day implied volatility index (BVIV) has fallen sharply to 48, breaking below the rising trendline that has persisted since September. Volatility compression of this magnitude is historically associated with:
- reduced panic selling
- stabilization of leveraged positions
- increased probability of a directional breakout
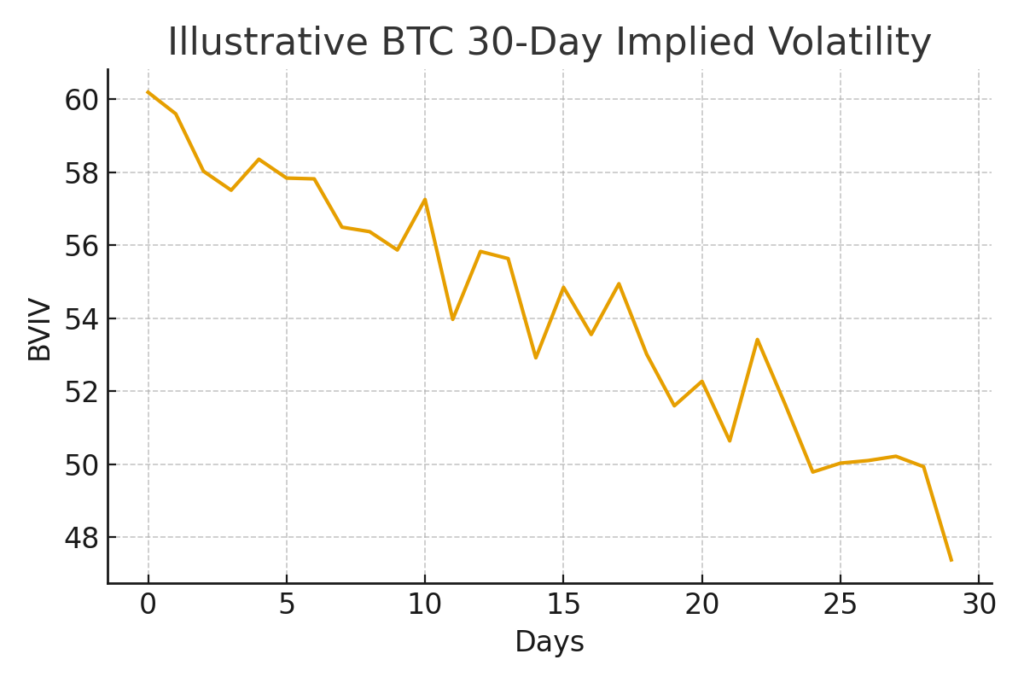
A falling volatility index does not guarantee price direction, but when combined with supportive market structure—as BTC currently shows—the bias often shifts bullish.
1-2. DXY Weakness Reinforces Bullish Expectations
The U.S. Dollar Index (DXY) continues its downward trajectory after breaking key support levels. Since November of the previous year, Bitcoin’s volatility has shown a persistent negative correlation with DXY. A declining dollar historically:
- boosts risk asset flows
- improves global USD liquidity conditions
- attracts institutional buyers seeking inflation-resistant assets
This macro backdrop strengthens the likelihood that Bitcoin may retest and potentially reclaim $100,000.
1-3. Key Technical Levels for BTC
Bitcoin reclaimed its $93,104 level—the high from November 28—as support, indicating strong market memory around this price. BTC has also moved decisively above the Ichimoku cloud on the hourly chart, confirming bullish bias.
The next key levels are:
- $98,000 resistance, defined by a downtrend line
- $100,000 psychological barrier, historically a high-reaction zone
Momentum is expected to accelerate when the MACD bullish crossover appears on the hourly timeframe.
If BTC falls back below the Ichimoku cloud, however, the bullish thesis weakens and the market may re-enter a consolidation phase.
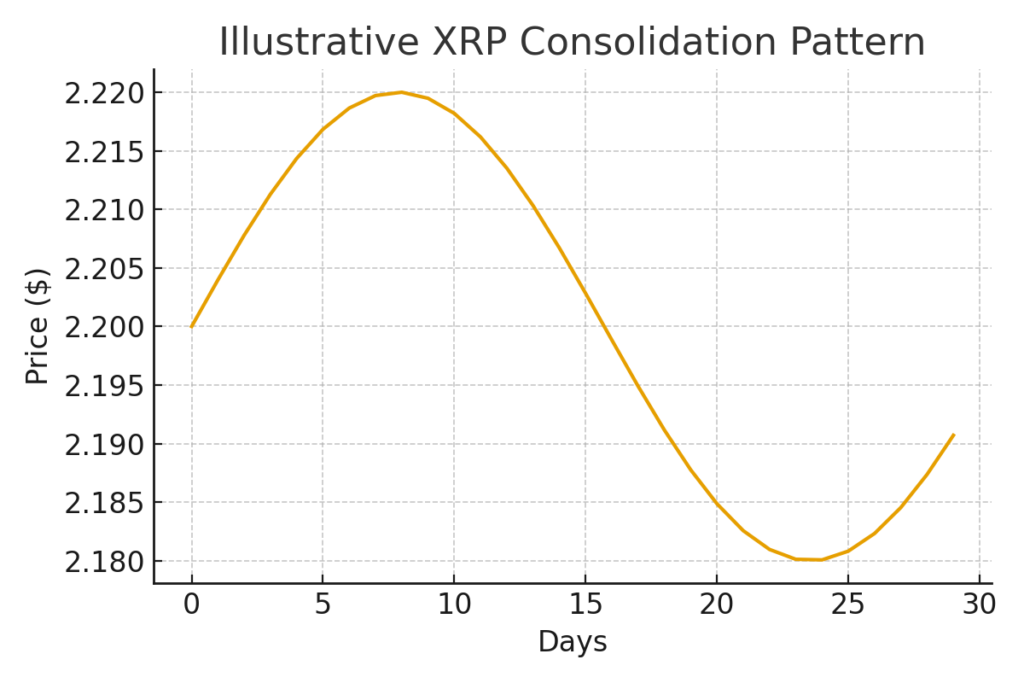
SECTION 2: XRP Builds a Stable Foundation at $2.20
XRP recently broke above its Ichimoku cloud, entering bullish territory before settling into a sideways consolidation around $2.20. Although the hourly MACD histogram shows a bearish crossover, price resilience remains notable—the price is not dropping despite weakening momentum, which typically implies accumulation.
Key resistance levels:
- $2.28
- $2.30
A breakout above these levels would likely trigger algorithmic buying and open the path toward a renewed bullish continuation.
What supports the bullish case?
- Lack of downward follow-through despite momentum weakness
- Strong liquidity around core support
- Long-term holders continuing to accumulate XRP for cross-border settlement-based utilities
With financial institutions still exploring on-chain settlement frameworks, XRP may remain one of the strongest fundamentally aligned tokens.
SECTION 3: Ethereum Strengthens After Confirmed Bear Trap
Ethereum’s price action has been one of the strongest among large-cap assets. A confirmed bear trap, validated by two consecutive strong green daily candles with minimal lower wicks, indicates that buyers quickly absorbed sell pressure.
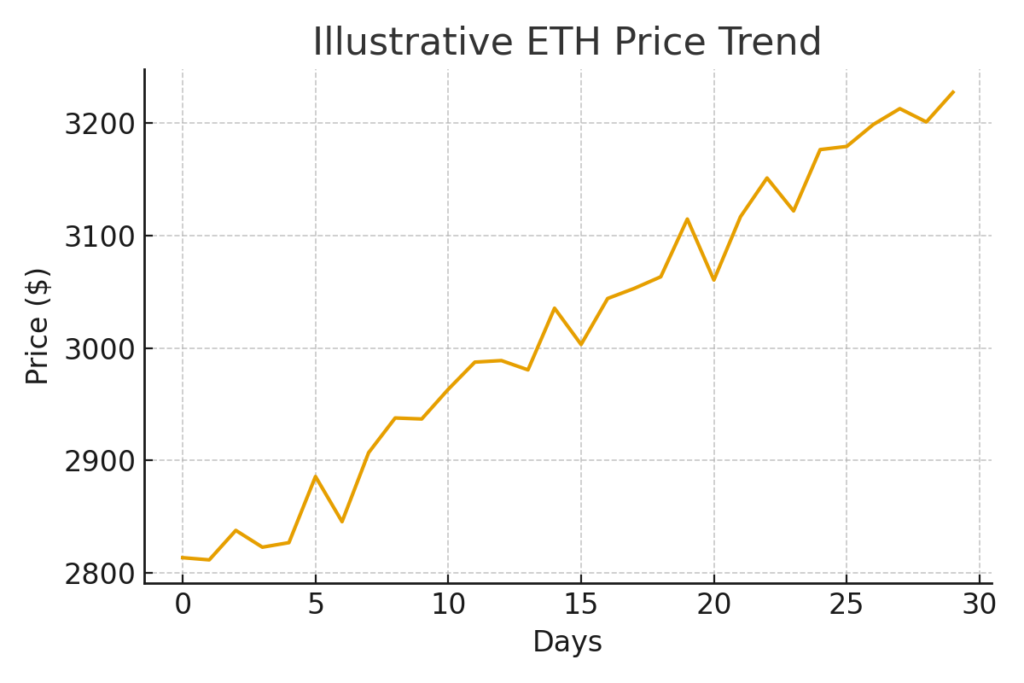
Additional factors strengthening ETH’s bullish structure:
- Daily MACD histogram in positive territory
- Strong demand for ETH in upcoming staking-related protocols and layer-2 ecosystems
- Institutional ETF flows that continue to drive long-duration accumulation
The next upside target sits around $3,510, the low from October 10, which now acts as a magnet level.
Short-term caution:
ETH’s hourly MACD approaches a bearish crossover, suggesting a temporary dip to $3,100 may occur before the next leg upward. Such pullbacks are typically healthy within strong uptrends and often serve as re-accumulation opportunities.
SECTION 4: Solana Approaches a Breakout Toward $165
Solana trades near $144.74, a crucial upper boundary of a consolidation range. Historically, SOL breakouts tend to be aggressive due to the chain’s high-velocity speculative activity and strong developer ecosystem momentum.
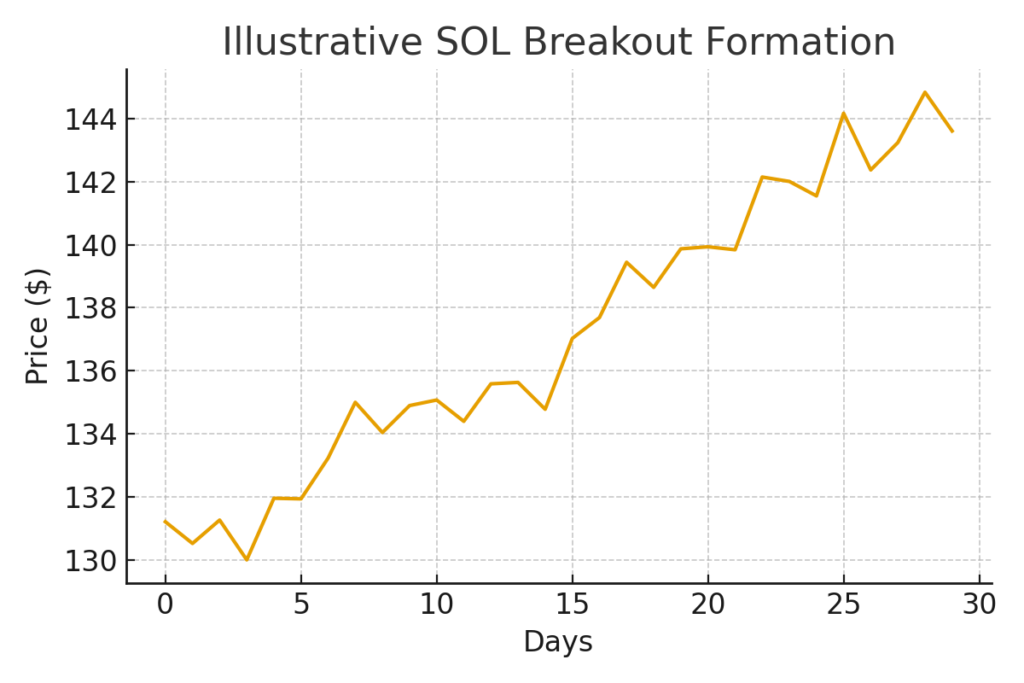
The Major Move Method suggests an upside target of $165 if SOL achieves a decisive breakout above its current ceiling.
However, similar to XRP and ETH, the hourly MACD shows a bearish crossover, implying:
- a short-term correction may occur
- consolidation could deepen before breakout confirmation
- buyers should watch for reclaiming momentum on the hourly timeframe
Solana remains one of the strongest alternative layer-1 ecosystems, backed by expanding DeFi activity and improved network stability compared to previous cycles.
SECTION 5: Cross-Asset Volatility and Institutional Positioning
A critical trend across BTC, ETH, XRP, and SOL is volatility compression. This phenomenon typically precedes high-magnitude directional moves. Additional data from institutional derivative providers show:
- reduced demand for downside protection
- rising open interest in call options
- expanding spot-ETF inflows for BTC and ETH
This reinforces the idea that markets are preparing for a significant price expansion phase.
More broadly, industry developments suggest that:
- TradFi platforms are integrating tokenized assets at accelerating rates
- Payment processors are adopting stablecoins more aggressively
- Government proposals for digital asset frameworks continue to advance
This environment tends to benefit assets with established network security, liquidity depth, and institutional familiarity—BTC and ETH most notably.
SECTION 6: What This Means for Investors Seeking New Crypto Opportunities
For investors searching for new assets or new revenue opportunities, current conditions offer several insights:
1. BTC and ETH remain primary trend leaders
When volatility compresses, large-caps typically expand first. Smaller assets gain momentum afterward.
2. XRP and SOL provide high-potential setups based on structure
XRP shows strong base formation, while SOL’s breakout pattern is technically compelling.
3. Macro conditions support risk-on behavior
A weakening dollar and increasing ETF flows reinforce bullish bias.
4. Volatility-squeeze patterns may create asymmetric opportunities
Periods like this often precede multi-week rallies.
CONCLUSION: A Market on the Edge of Expansion
Bitcoin’s approach toward the $100,000 mark is not merely a psychological storyline.
It is backed by:
- clear volatility compression
- strengthening macro conditions
- strong recovery of key technical levels
- positive structural flows
ETH, XRP, and SOL each present their own bullish frameworks, suggesting that the broader crypto market may be positioned for another major upward movement.
If Bitcoin successfully breaks $98,000 and retests $100,000, the next wave of capital rotation into altcoins could begin—and historically, these phases produce some of the most profitable moments for investors seeking new opportunities.

