Main Points :
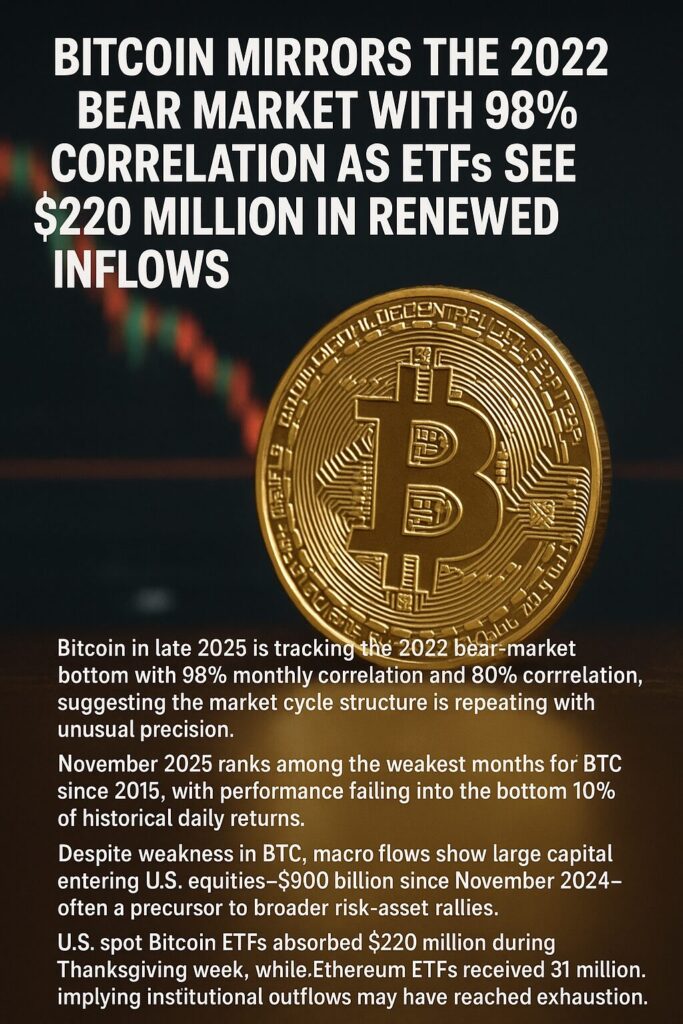
- Bitcoin in late 2025 is tracking the 2022 bear-market bottom with 98% monthly correlation and 80% daily correlation, suggesting the market cycle structure is repeating with unusual precision.
- November 2025 ranks among the weakest months for BTC since 2015, with performance falling into the bottom 10% of historical daily returns.
- Despite weakness in BTC, macro flows show large capital entering U.S. equities—$900 billion since November 2024—often a precursor to broader risk-asset rallies.
- U.S. spot Bitcoin ETFs absorbed $220 million during Thanksgiving week, while Ethereum ETFs received $31.2 million, implying institutional outflows may have reached exhaustion.
- Historical patterns imply that if the correlation continues, a meaningful rebound could emerge in Q1 2026, although this depends purely on observed historical similarities—not prediction.
INTRODUCTION — Understanding Bitcoin’s Strange Repeat of 2022
In an unusual display of historical symmetry, Bitcoin’s recent market behavior in 2025 is aligning almost perfectly with its movements during the capitulation phase of the 2022 bear market. According to network economist Timothy Peterson, BTC’s monthly correlation with its 2022 price path has now reached 98%, a level rarely observed in financial markets. The implication is simple: the current cycle is not developing along a typical post-halving trajectory. Instead, it is echoing the structure of the last major downturn.
This article analyzes the observed data, contextualizes it within global capital-flow trends, and introduces what this pattern might mean for investors who seek emerging opportunities, including altcoins, new blockchain utilities, and income-generating crypto instruments.
SECTION 1 — Bitcoin’s 98% Correlation With the 2022 Bear-Market Bottom
A Historic Level of Cycle Repetition
According to Peterson’s analysis, Bitcoin has declined 36% from its all-time high, mirroring the magnitude and timing of the 2022 decline almost exactly. This synchronization is visible across both daily and monthly data:
| Metric | Correlation With 2022 |
|---|---|
| Daily BTC/USD returns | 80% |
| Monthly BTC/USD pattern | 98% |
uch precision suggests that despite evolving market participants—ETFs, institutional actors, algorithmic traders—the market still follows behavioral cycles driven by liquidity stress, investor sentiment, and forced selling.
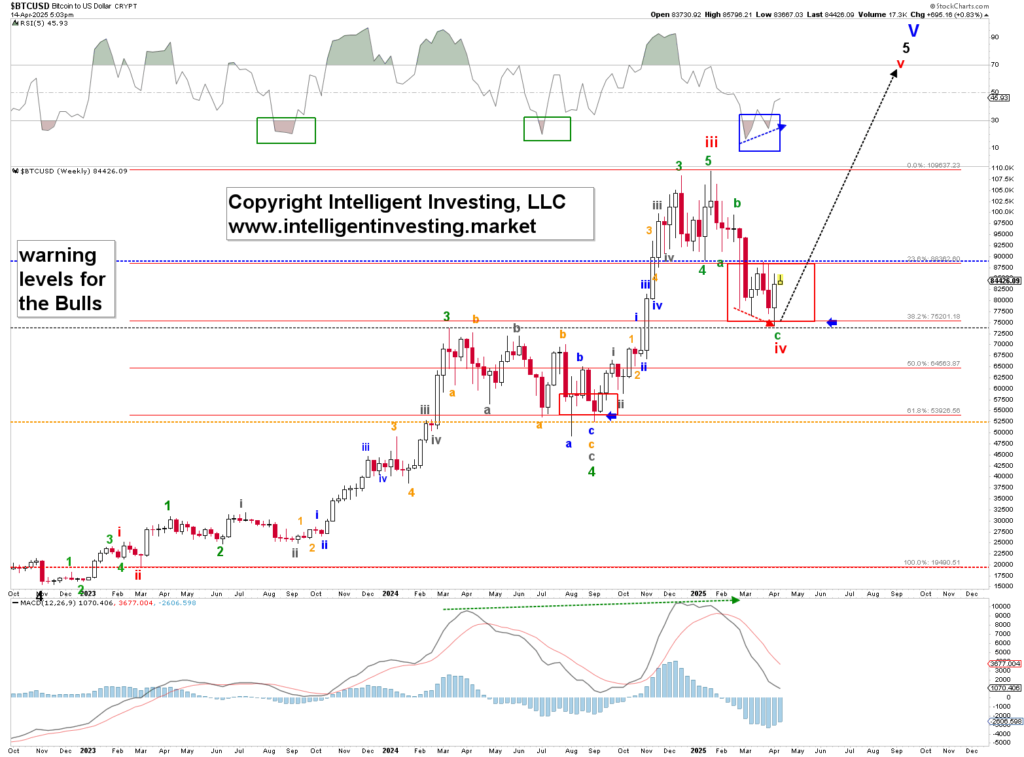
“BTC 2025 vs BTC 2022 Monthly Correlation (98%)”
“If It Feels Bad, It’s Because It Is Bad.”
Peterson’s November commentary characterizes the month as one of the worst for BTC since 2015—firmly within the bottom 10% of daily performance across the past decade.
Historically, when BTC prints a negative November, December is also often negative, although usually with milder downside.
Despite this pattern, the data does not indicate a long-term structural failure. Instead, it resembles the exhaustion phase before a new accumulation period.
SECTION 2 — Macro Capital Flows Show a Divergence: Stocks Rise, Crypto Lags
Equities Are Absorbing Massive Capital
Data from Bloomberg and JPMorgan, summarized by The Kobeissi Letter, shows:
- $900 billion flowed into U.S. equities from November 2024 to November 2025
- $450 billion of that came in the last 5 months alone
- Non-equity asset classes received only $100 billion
This is a dramatic imbalance. When equities start pulling liquidity aggressively, risk-on sentiment typically improves—and crypto historically follows with a delay.
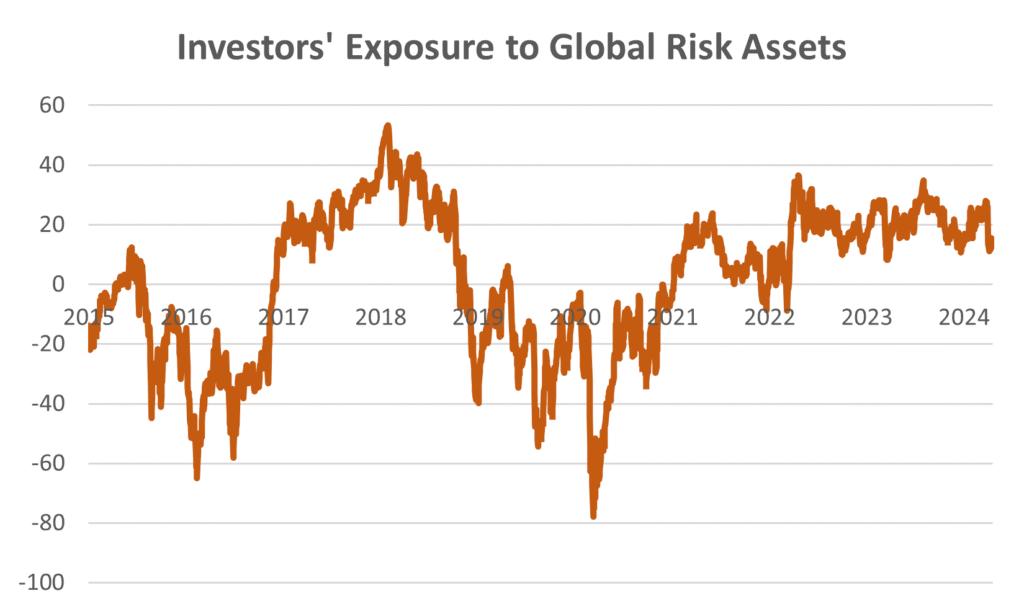
“Global Asset Class Inflows – 2024–2025 Comparison”
Why Crypto Underperformed During the Same Period
Crypto markets absorbed disproportionately large selling pressure during the recent downturn. Several reasons:
- ETF redemptions peaked earlier in 2025
- Traders de-risked aggressively due to macro uncertainty
- Dollar liquidity tightened temporarily in early Q4
However, these conditions appear to be reversing.
SECTION 3 — Bitcoin and Ethereum ETFs: A Clear Shift Back to Inflows
$220 Million Flows Into BTC ETFs During Thanksgiving Week
U.S. spot Bitcoin ETFs recorded $220 million in net inflows during the holiday week. Ethereum ETFs added an additional $31.2 million.
This does not guarantee a bull market—but it does provide evidence that:
- Forced selling has eased
- Institutional allocators are re-entering gradually
- Appetite for risk assets is stabilizing
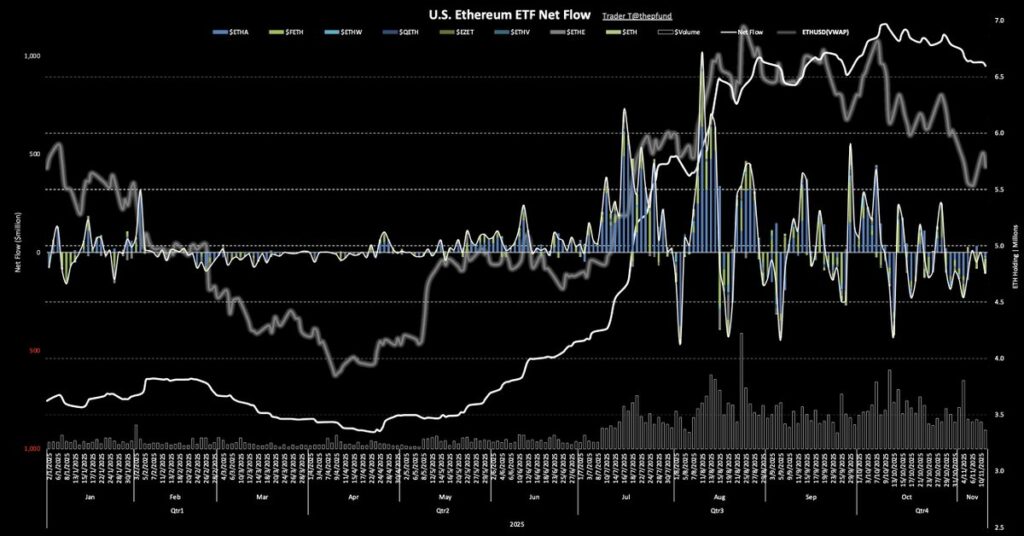
“Bitcoin & Ethereum ETF Net Flows – Latest Weekly Data”
ETFs are critical because they represent regulated institutional exposure. When they shift from outflows to inflows, it usually marks the end of panic-driven sell cycles.
SECTION 4 — What This Means for Investors Seeking New Assets and Income Opportunities
1. If Historical Correlation Holds, Q1 2026 May Bring Market Stabilization
The 98% correlation does not predict the future. It simply illustrates that the pattern so far is consistent with how the 2022 bear market bottom formed.
In 2022, accumulation began approximately 3–4 months after correlation peaked.
If the same timeline repeats, signs of stabilization may appear around Q1 2026.
2. A Shift Toward Altcoins and Yield-Bearing Assets
During prior recovery periods:
- Layer-1 alternatives (e.g., Solana, Avalanche) rallied first
- Yield-bearing DeFi assets saw renewed inflows
- Infrastructure tokens with real usage (or staking rewards) attracted capital
Given the ETF recovery and macro inflows to equities, the risk-on tide may eventually reach the crypto ecosystem.
3. Utility Tokens and Real-World-Asset (RWA) Protocols
Market participants increasingly favor assets with:
- Cash-flow mechanics
- Institutional integrations
- Compliance-ready infrastructure
These categories historically outperform speculative meme-driven assets after major downturns.
SECTION 5 — The Role of Bitcoin ETFs in the Next Cycle
ETF flows have become the new macro indicator of crypto demand.
They influence:
- Spot liquidity
- Long-term price floors
- Institutional risk models
If inflows continue into December and January, it would reinforce the thesis that the worst selling pressure is behind the market.
SECTION 6 — Final Outlook: A Difficult Month, A Familiar Pattern, and a Potential Turning Point
Bitcoin’s repeat of its 2022 pattern is not a prediction—it is an observation.
But the observation matters.
The combination of:
- 98% price correlation with 2022,
- one of the weakest Novembers since 2015,
- macro inflows to equities, and
- renewed institutional ETF interest,
paints a picture of a market that may be nearing the end of its corrective phase.
For builders, traders, and investors seeking new crypto assets or yield opportunities, this environment often marks the period where strategic positioning has the highest asymmetry. It is precisely during weak markets—not euphoric markets—that foundational gains are made.